


1889 Profitable Trading Strategies
Ramping up the generative strategy machine


In one of my last articles (here), I created an automated way to generate trading strategies and evaluate them for effectiveness. I was left with 164 base systems that were all unique, with many exceeding 20% CAGR after transaction fees.
However, most of the strategies were highly correlated because I was using a single basket to test the profitability. Thus, I decided to create 10x the strategies on a wide array of different baskets to solve this problem.
And while you may think that using the same systems with simply differing baskets would not change the performance drastically beyond 20% CAGR, I actually was able to achieve a system that beat the best expert in hindsight.
Here’s how I did it
Instead of just generating systems, I used clustering to identify 25 main and uncorrelated strategies and used those in a novel new metastrategy system.
The results are astonishing.
10x’ing the Generation System
I already have a system that generates bespoke strategies and an evaluation system that tests to see if they are good or not.
So, I made a search system that generated a random basket of 10 stocks from the 69 S&P Dividend Aristocrat stocks and selected a random strategy from my generated strategy bank. It would then run that selection across the 4 lookback windows and 2 rebalancing times for a total of 8 variations.
Strategies that made 16% CAGR in-sample (from 2000 → 2020) after transaction fees of 10bps were kept. The others were thrown out.
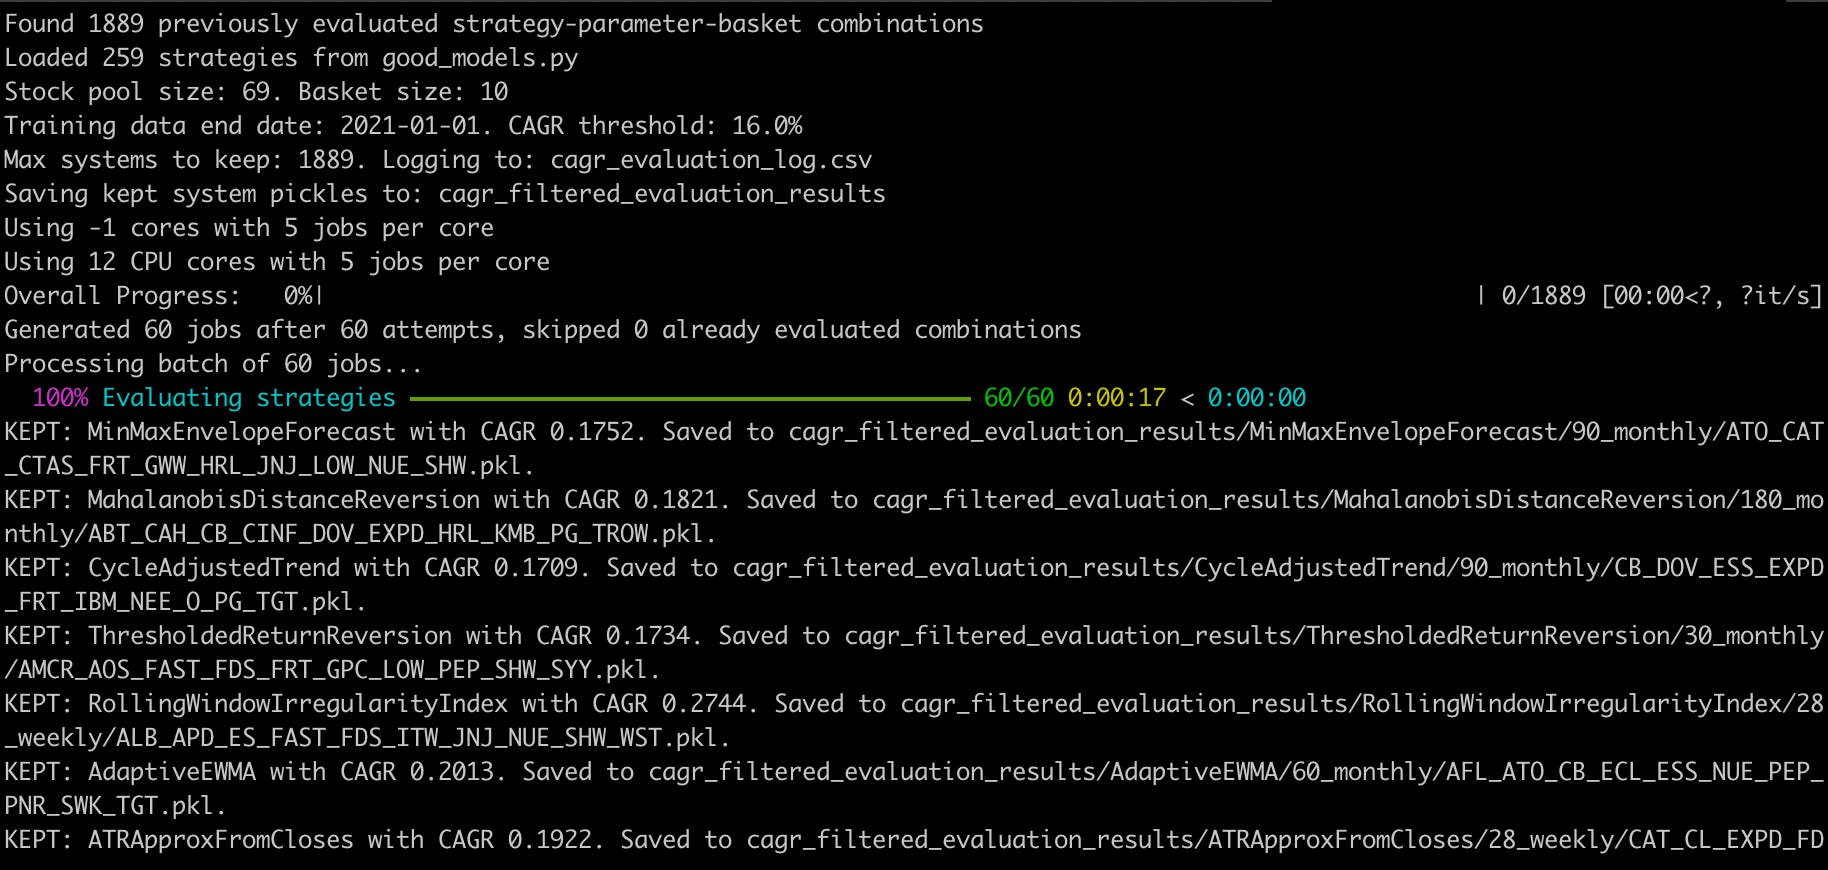
Evaluating a batch took about 15 seconds. So, each strategy took only 0.25 seconds. I was able to generate a kept list of 1889 in about 25 minutes.

Evaluating the 1889 Strategies
I wrote a simple script to read all the backtests from all of the strategies and conglomerate them into a single results data structure that my backtesting platform portwine (GitHub repo here) can process. Writing a strategy that in real time steps through all 1889 strategies would take forever and I just wanted a sanity test for now. I averaged out the returns, and got this as a result:
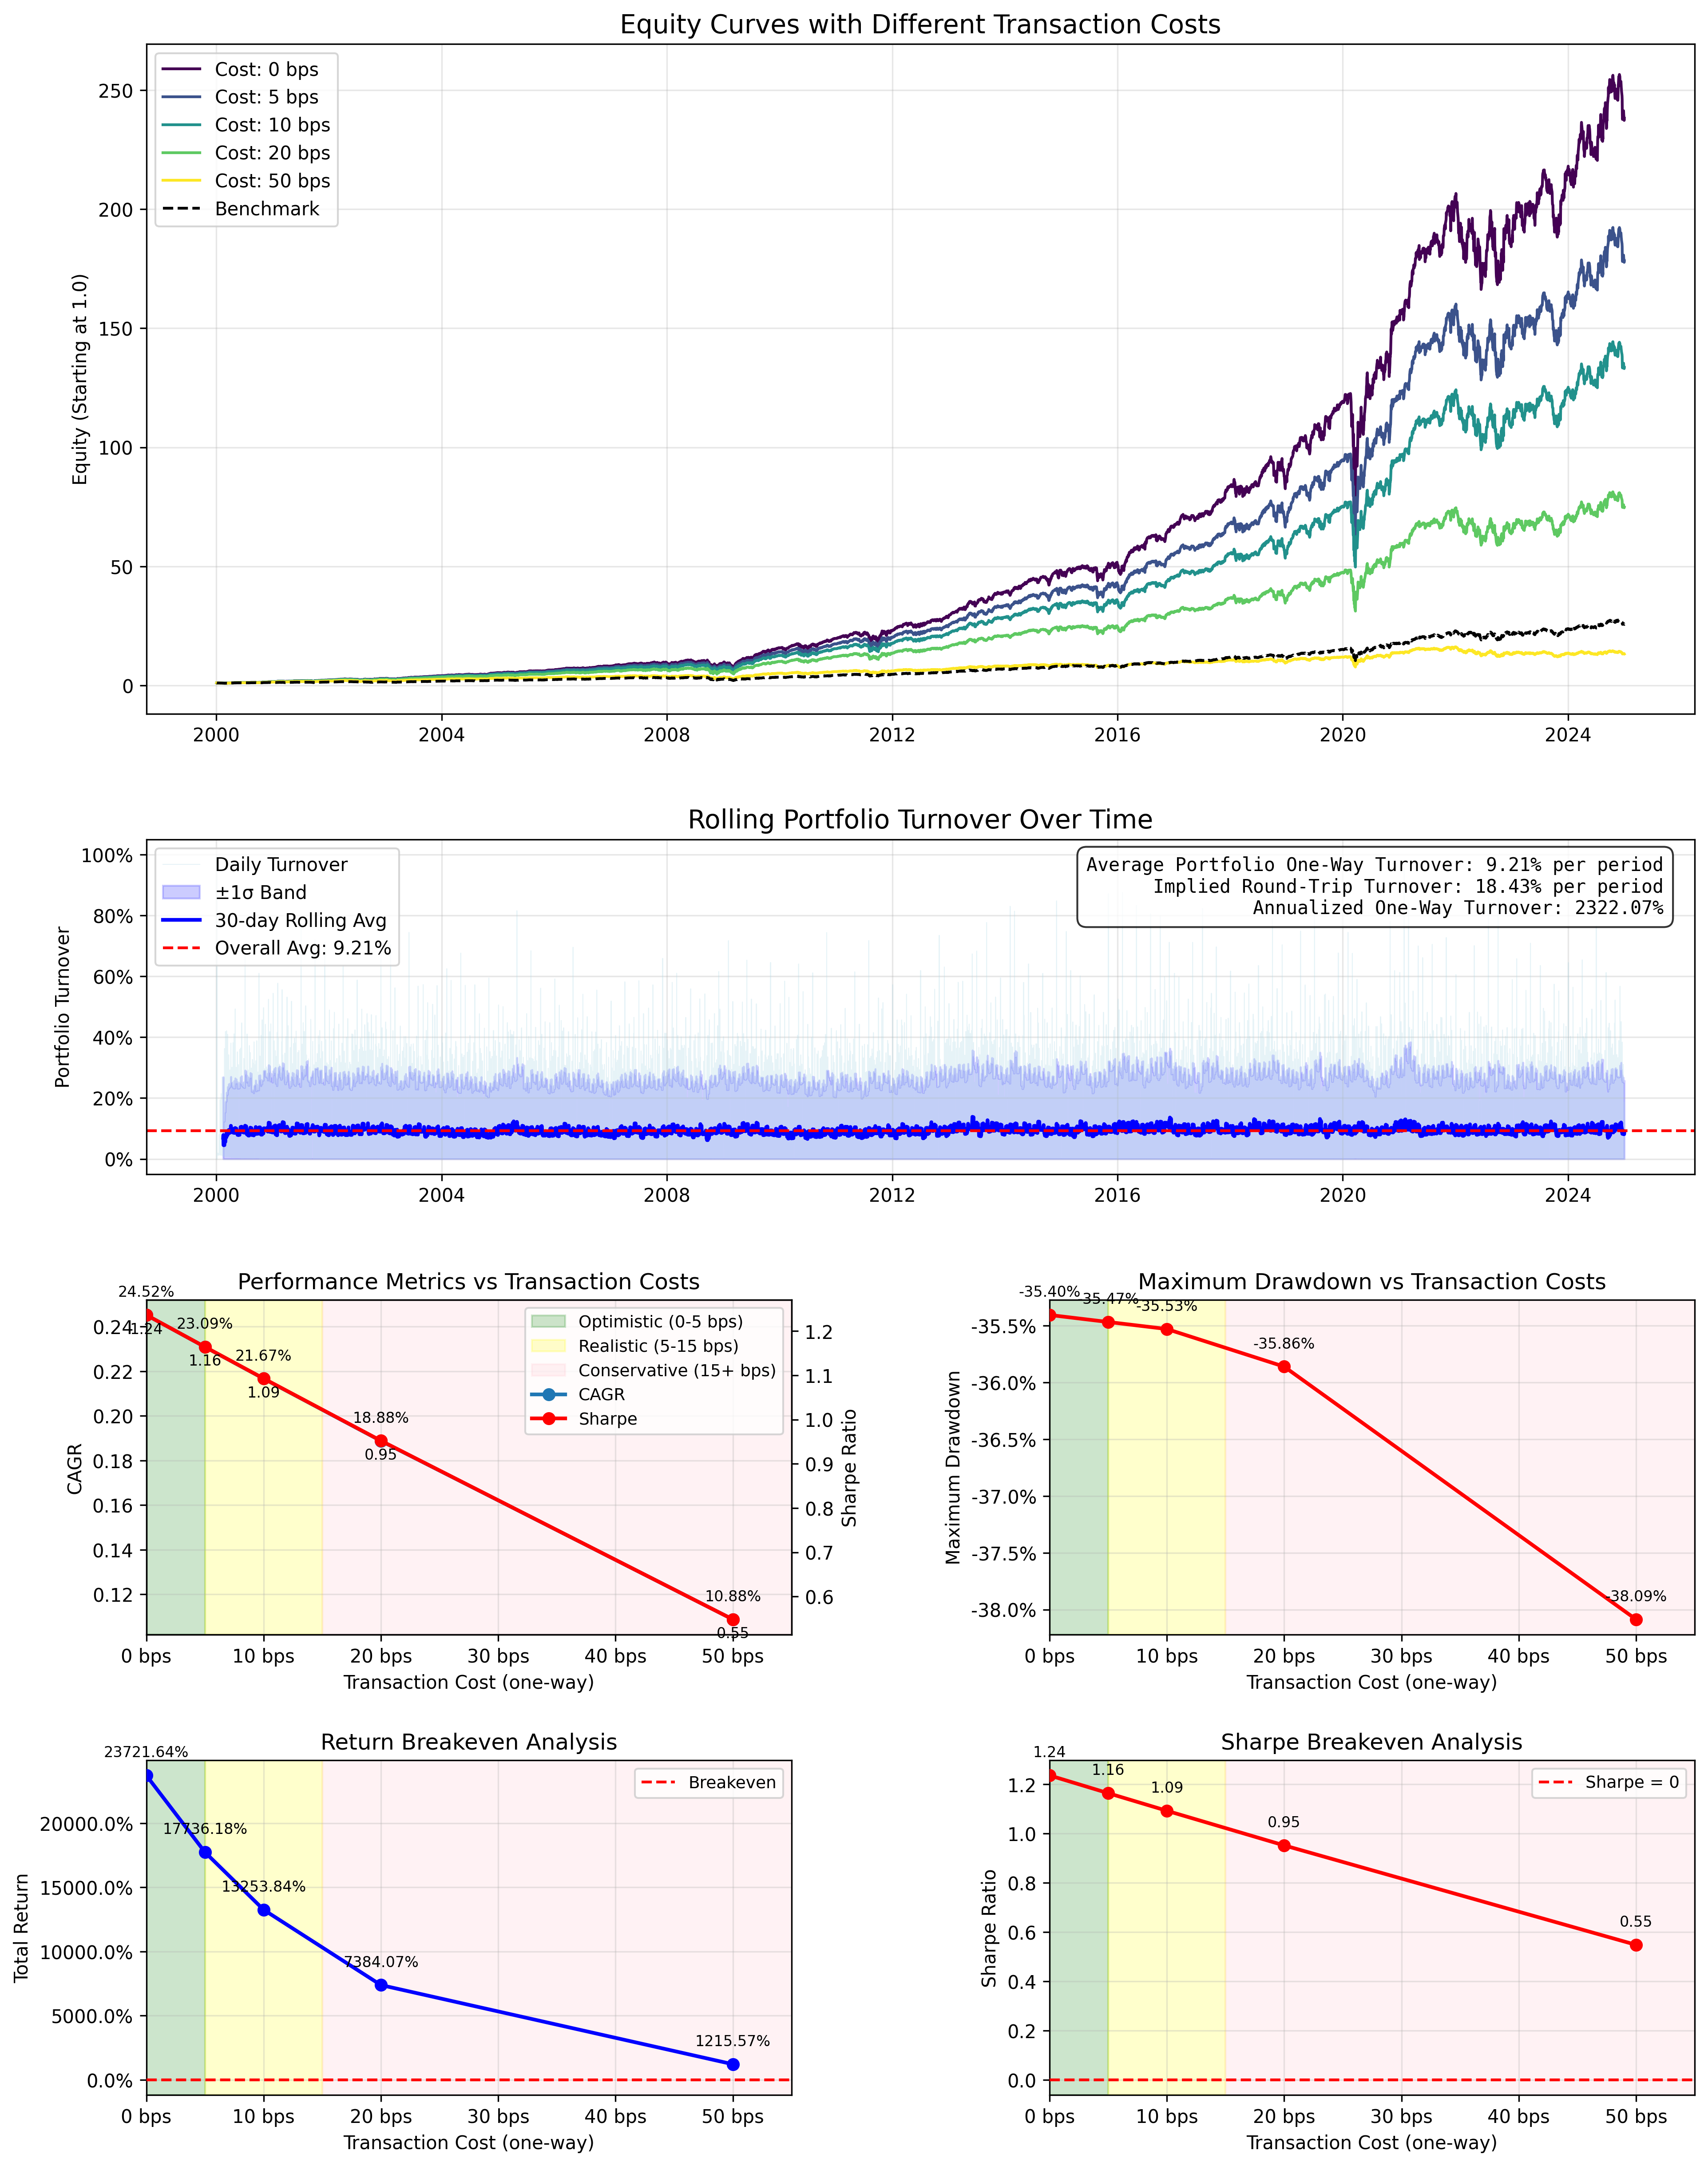
Very impressive stuff! But I was worried about the risk of these strategies really taking their alpha from the best selected basked. Only 20% of strategies passed the scoring requirement of 16% CAGR, so I was concerned that those 20% shared similar stocks and that was why it was performing so well.
So, I counted the occurrences of each stock across all 1889 strategies.
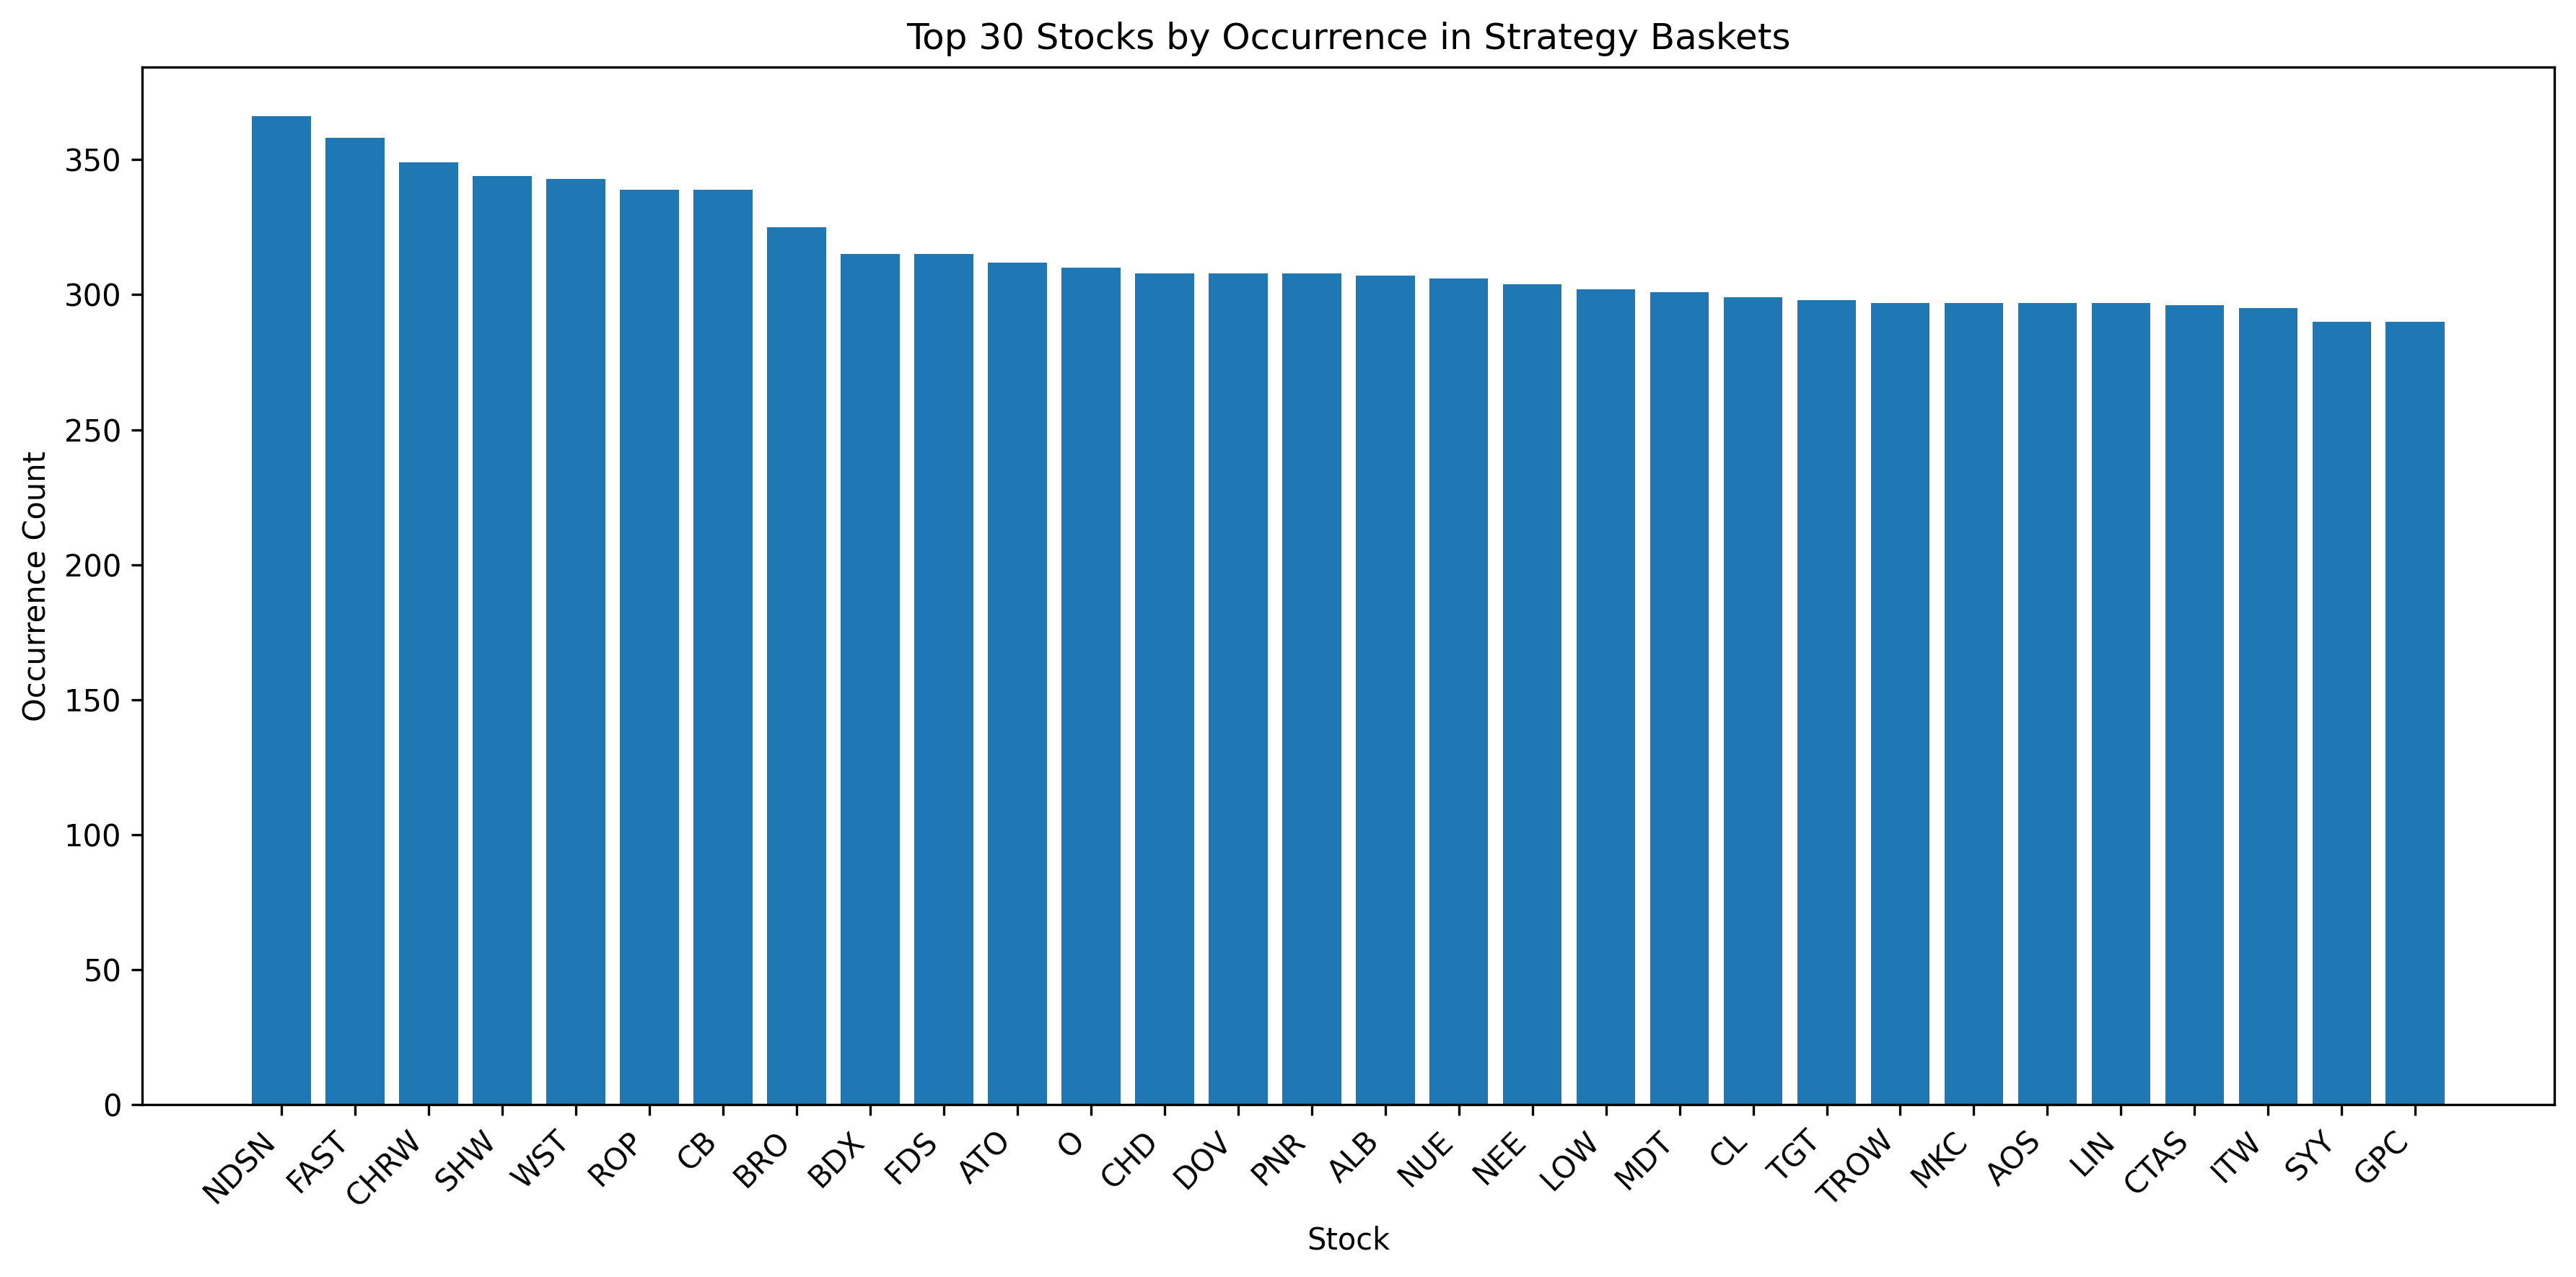
I then calculated the proportion of each stock’s occurrence in comparison to all other stocks to create a weighed strategy to test my hypothesis.

Luckily, my fears turned out to be just fears. Allocating the proportion of the stock occurrences to a weighted strategy does not outperform the 1889 profitable strategies found.

Finding Correlation
1889 separate systems is extremely cumbersome to work with. So, I employed hierarchical clustering to find groups of strategies that were similar to each other but different from the rest. This gave me 25 different ‘families’ of systems that were unique.
Hierarchical clustering requires me to first calculate correlation between each strategy. Rather than using a simple Spearman’s correlation on the returns, I decided to do one on the drawdown curve instead.
This is because all the strategies trend upwards and to the right. They are highly correlated to each other as is. Looking at the drawdown not only gives us a better picture of the differences between each strategy, it also lets us attempt to find clusters that hedge against each other to create a better trading algorithm.

Even with this adaptation, it’s clear in the above correlation matrix that most strategies are still highly correlated with each other. But, this was good enough, as you will see.
Hierarchical Clustering
Hierarchical clustering groups data into ‘families,’ kind of like the tree of life.

Except, instead of species, it’s pieces of data. It finds common attributes from a high level, and then attempts to split the data where those attributes differ.
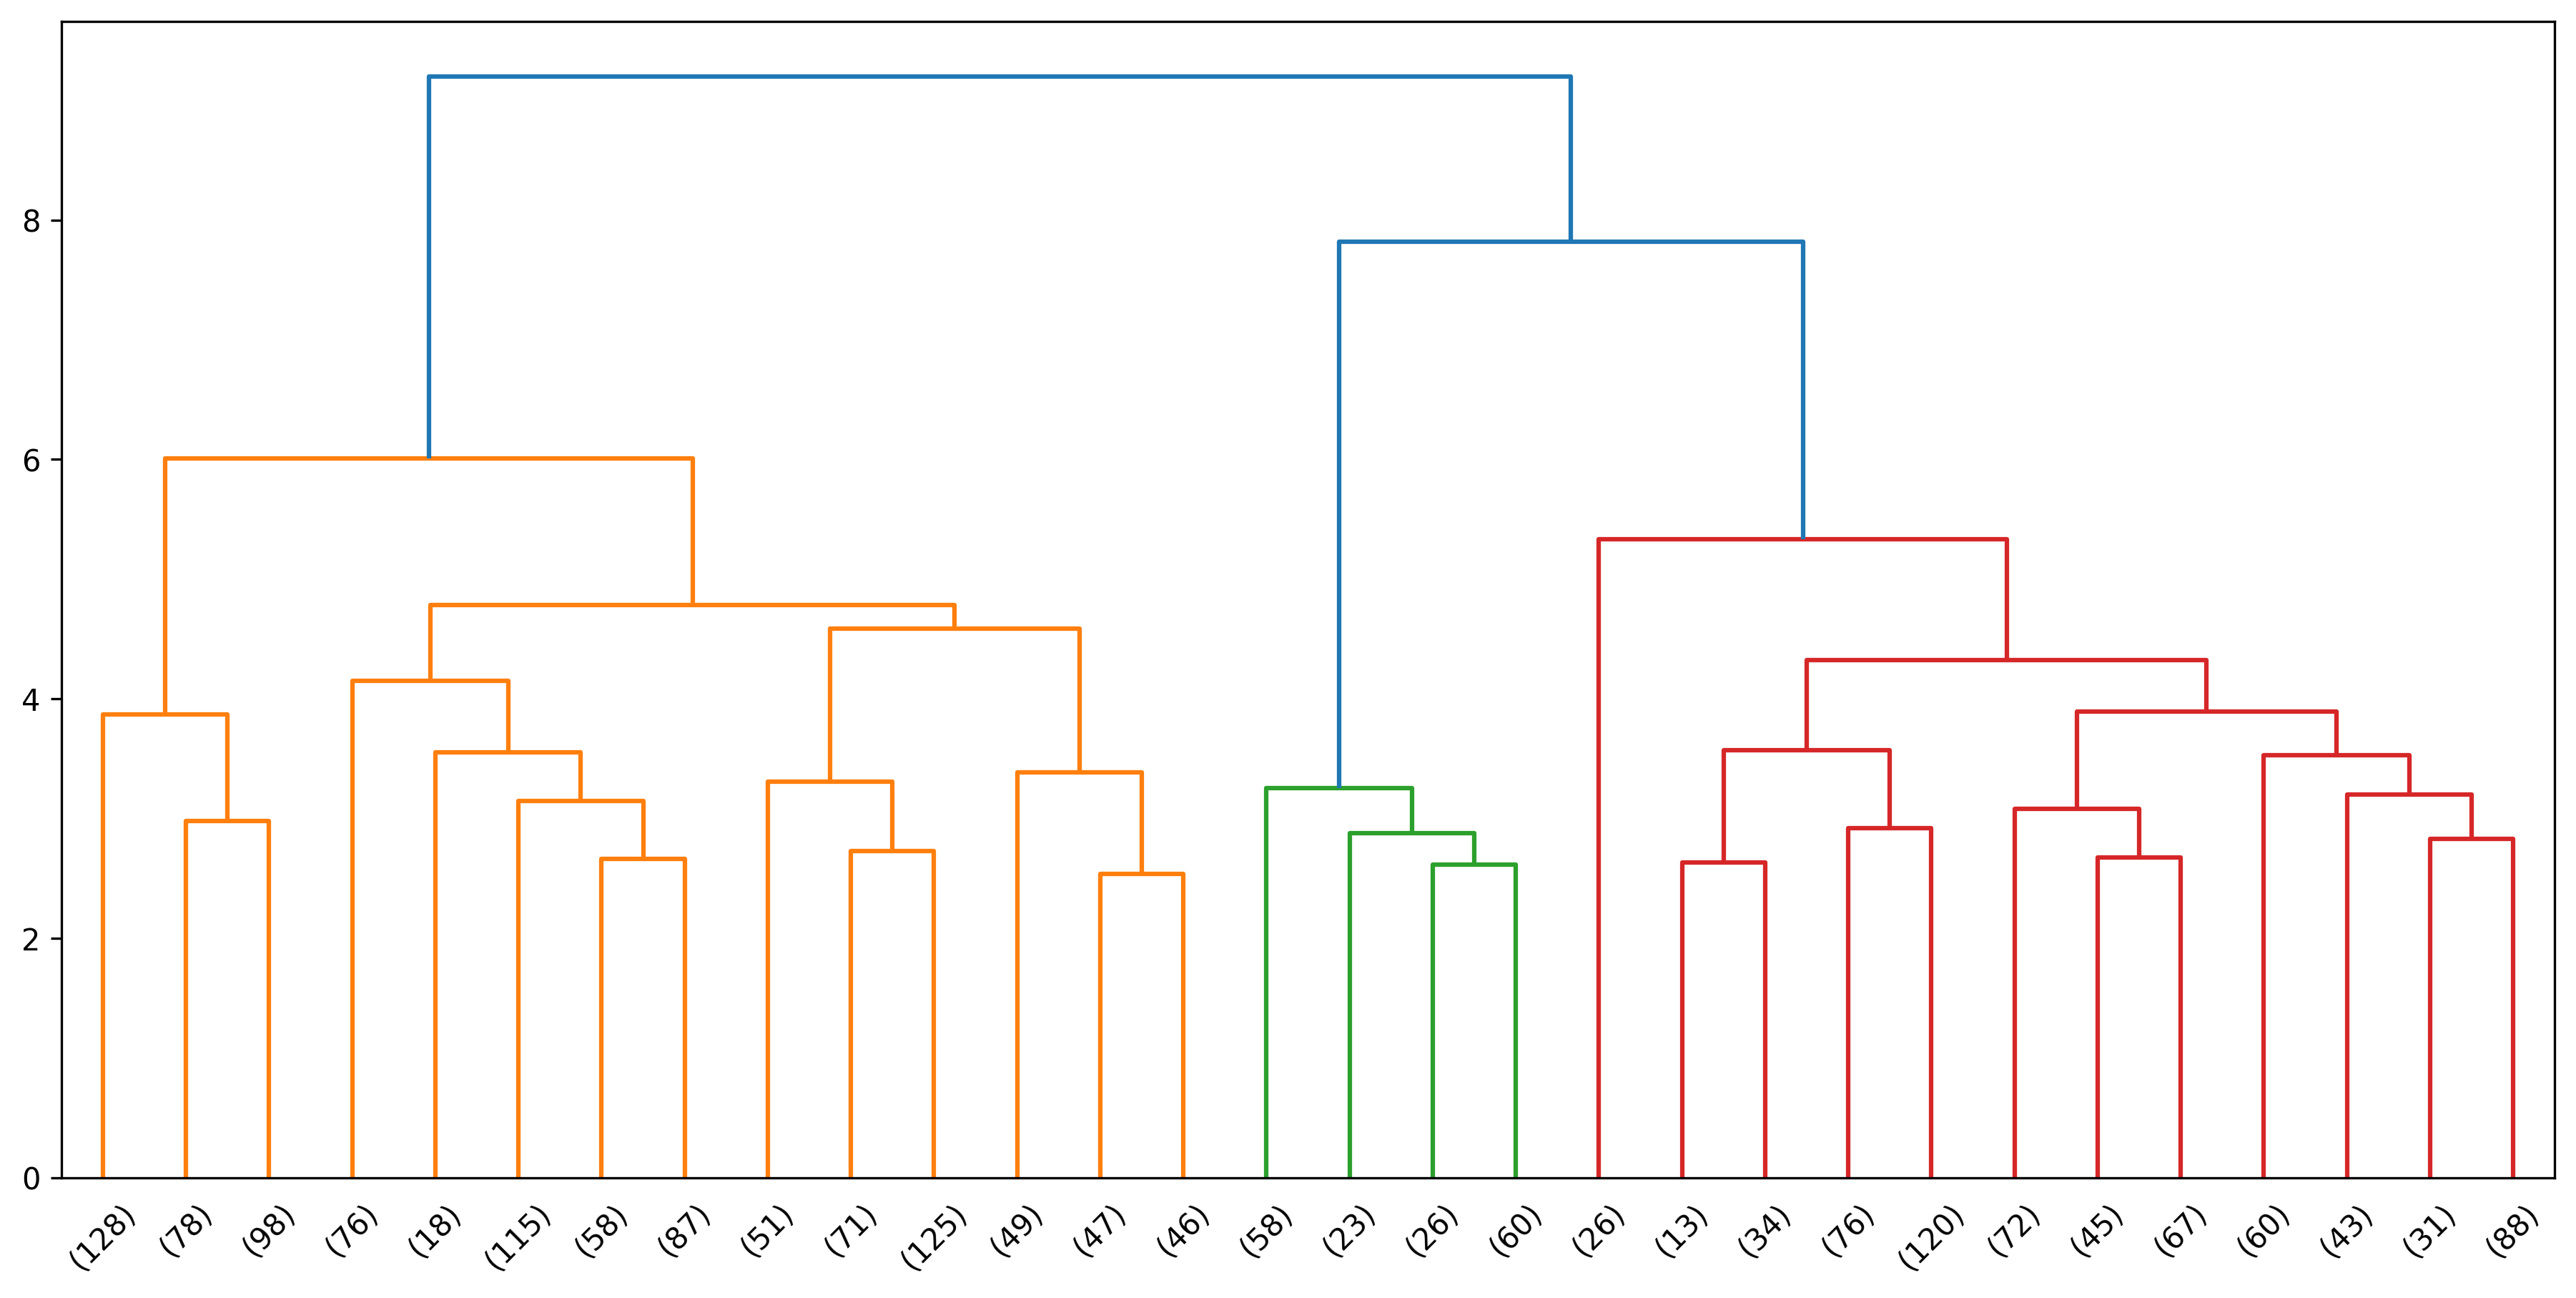
Running the drawdown correlation data on the hierarchical clustering algorithm set at 25 clusters worked surprisingly well. Below is a selection of 30 strategies and how that looks visualized in a dendrogram.
And here is the correlation matrix that is now much easier to read.

What is also great about clustering is that the size of each cluster varies. Therefore, similar, repeat strategies are no longer overcrowding our basket of trading strategies. We’ve boiled it down into 25 classes that all have unique traits.
Plotting Performance
I then plotted the top 10 clusters by performance to visualize how things went. Each equity curve is the average equity of all strategies in that particular cluster.

Our top performers all beat our current state-of-the-art strategy of all 1889 strategies bundled together.
The question now is how we allocate to these top performers so that we can take advantage of these clusters as they emerge as leaders. There is clearly have lookahead bias in the above chart, so I had to come up with an online way to achieve the same performance, or better, in real-time.
Beating the Best Strategy
I previously wrote about a metastrategy based on Tracking the Best Expert which is a strategy for following the best expert given changing dynamics. It works well. But, I continued researching and discovered a much better system that uses an autoregressive model to rank systems based on their recent momentum and allocates to the one’s posed to exhibit the most short term momentum.
I used data up to 2021-01-01 to get the best performing strategy from each cluster to get a basket of 25 systems. I then ran that through the metastrategy and plotted its results against our original uniform system and the best expert in hindsight.
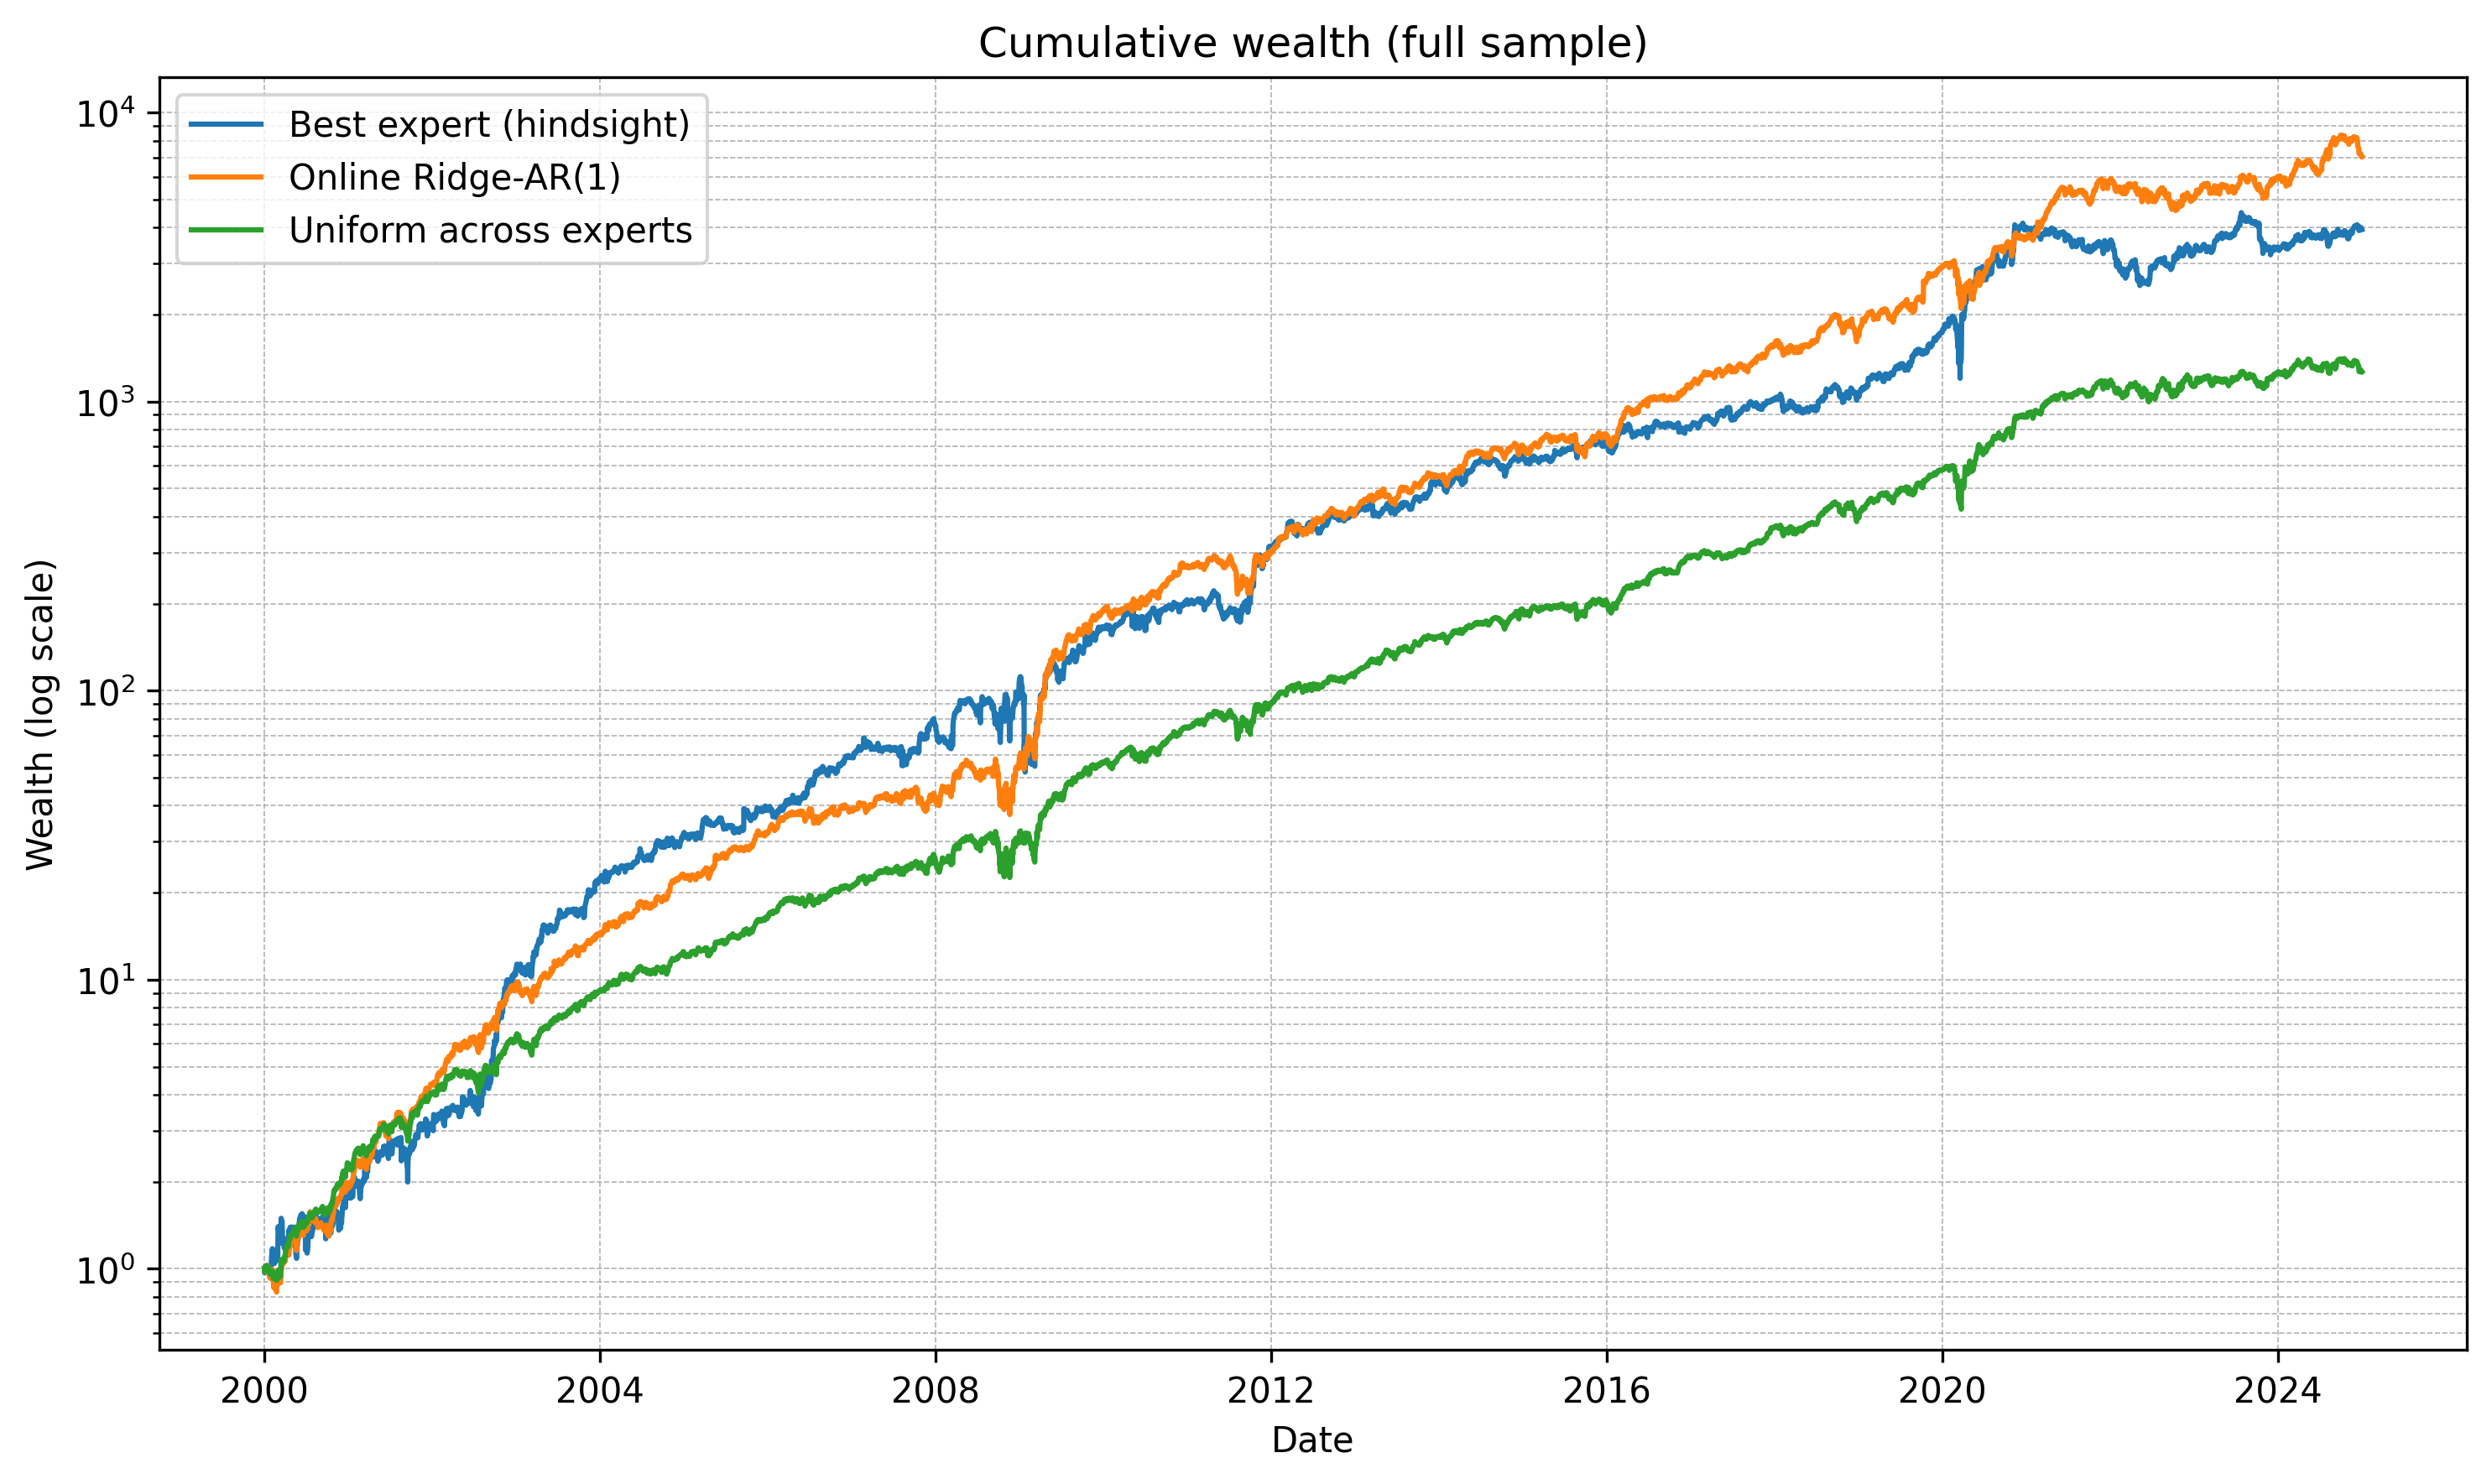
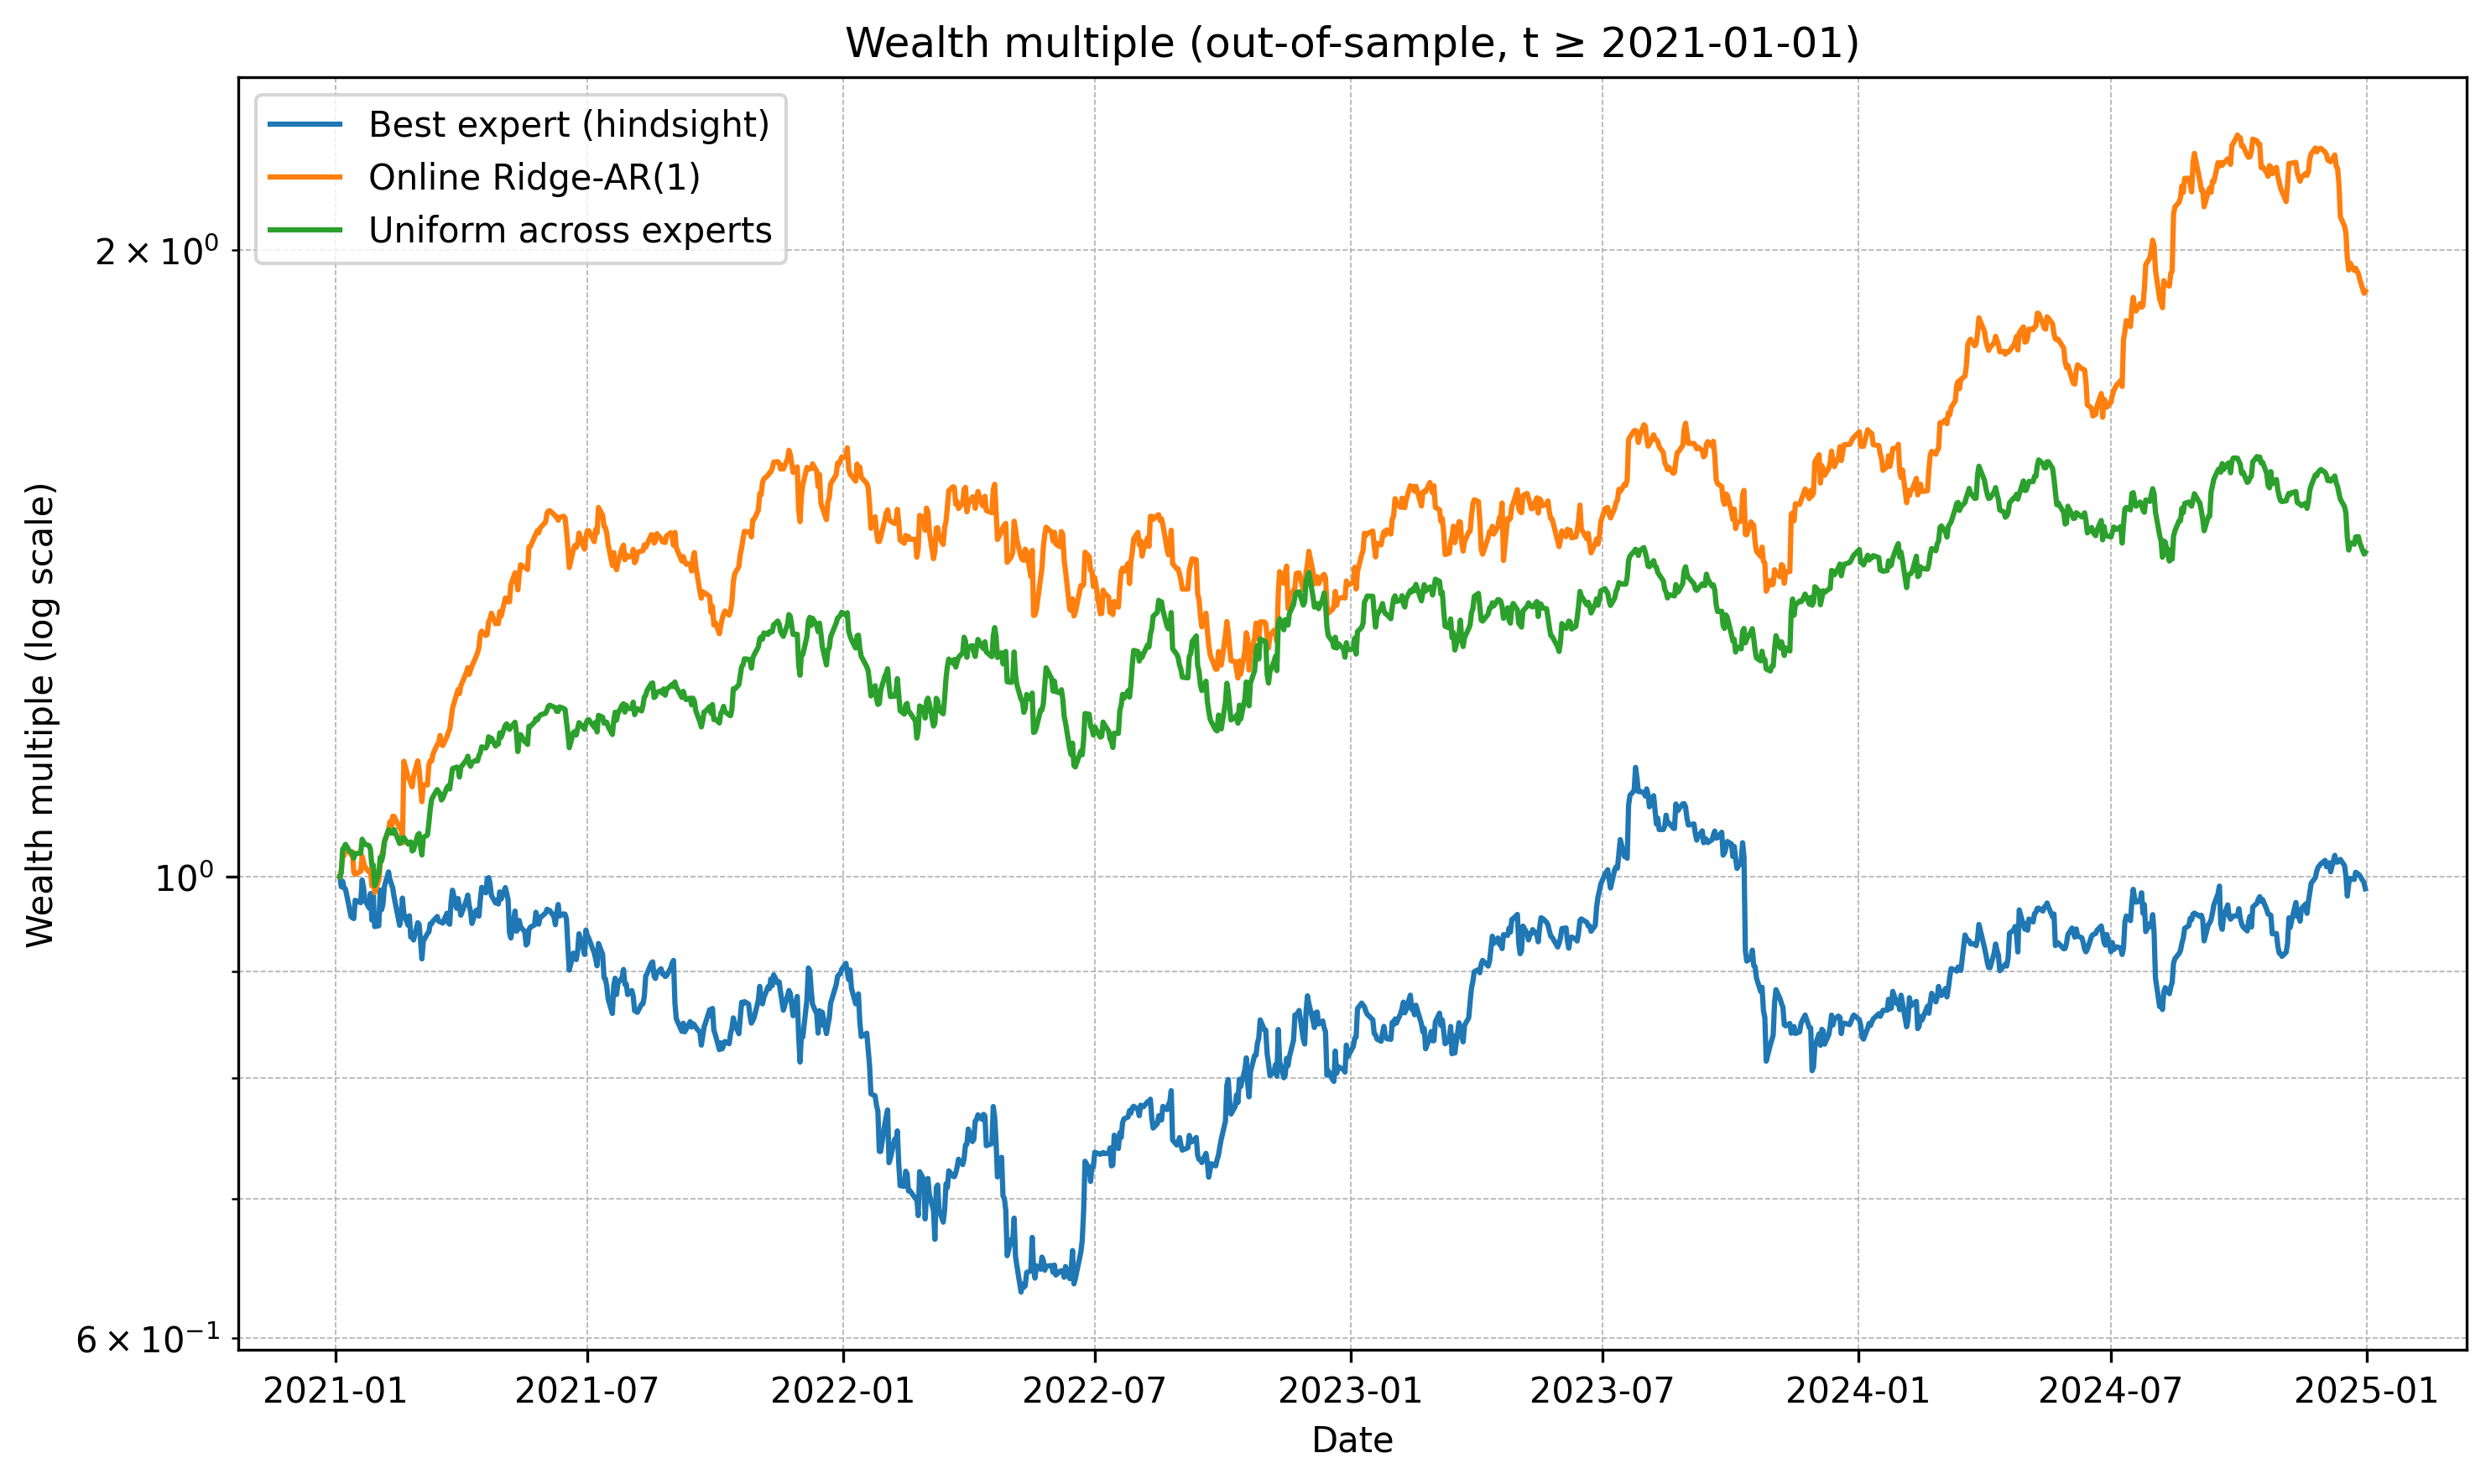
The results speak for themselves. The Online Ridge-AR(1) system outperforms them all, especially in out-of-sample data.
Here are the final statistics:
Final wealth (full period)
  Best expert (hindsight)     : 3938.23
  Online Ridge-AR(1)          : 7032.76
  Uniform across experts      : 1265.78

Wealth multiples (t ≥ 2021-01-01)
  Best expert (hindsight)     :    0.99×
  Online Ridge-AR(1)          :    1.91×
  Uniform across experts      :    1.43×
And thus, we went from achieving 1265x our portfolio since 2000 by aggregating all of our 1889 strategies to over 7000x with clustering and a solid metastrategy.
Next Steps
Much like the 164 Trading Strategy catalog, expect a 1889 Trading Strategy catalog in the next week. If you want to dive into things yourself, I’ve uploaded all 1889 backtests (over 2GB) in the private Google Drive along with the code needed to replicate the systems constructed here.
Happy trading and research!
Appreciate the value you are delivering
When is your execution? same day close, next day close, or something else?