


164 Profitable Trading Strategies
And how to generate 10,000 more


As mentioned in my last post (here), I designed and developed a way to quickly produce trading systems with the help of generative AI. And while this sounds like a recipe for disaster, because I constrained the problem to a very specific subset and I focused on only a few factors, the results were actually quite amazing.
From 875 candidate strategies, I manually filtered out 259 contenders. Using Principal Component Analysis, I discovered that many of those were ‘overlaps’ in terms of the factors they took advantage of. I condensed down that list to 164 new and bespoke portfolio allocation systems that often times outperform the state-of-the-art references I was using.
Here’s how I did it.
Want to explore the strategies first? Check out the 164 Trading Strategy Catalog by clicking below:
The Process
Ideation
The raw generation process was pretty simple. As I discussed in my previous post (here), I broke the problem down into a very specific and abstracted requirement. I only needed a single function to be developed. I had specifics for the format of the input, output, ranges for all the numbers, expectations, etc. So, I came up with a prompt that was clean, concise, and robust for generating ideas (see here). Each shot would generate 100 ideas at a time after I fed it into an LLM. I focused specifically on technical analysis systems to keep things simple.

The outputs were idea stubs that looked like this:
Adaptive EMA Crossover
Uses a short and long EMA whose lengths adapt to recent volatility (higher vol → shorter EMAs).
Scores = current_price × (EMA_short/EMA_long).
Volatility‐Scaled Momentum
Computes momentum over window and divides by recent realized volatility.
Scores ∝ momentum/σ, tilting toward stable strong trends.
RSI Extremum Reversion
For each asset, RSI over window; if RSI>70, score = current_price×(1–(RSI–70)/30); if <30, score=current_price×(1+(30–RSI)/30); else current_price.
Bollinger Band Trend
Build ±2σ bands on moving average; when price breaks above upper band, score = current_price×(1 + breach_pct); below lower, score=current_price×(1 – breach_pct); inside bands, revert to mean.
Keltner Channel Fade
Uses ATR‐based channels; scores = channel_midpoint for inside moves, and for channel touches, score = current_price × (1 – sign(touch)k(distance/channel_width)).
Each of these stubs went into a single text file. I generated 875 unique strategies like this and felt like it was starting to just regurgitate the same type of system over and over again so I moved onto the implementation stage.
Implementation
I then used the same prompt, but slightly modified for code generation. I had it generate systems in batches of 20 at a time and output them all into an ‘implementation bank’ which was more or less just a list of files.

Verification
So 875 programmed strategies is pretty good. But I needed a way to sift through these all. I wrote a simple evaluator that read all of the files, extracted the classes, and ran them inside of my portwine backtesting system (available here).
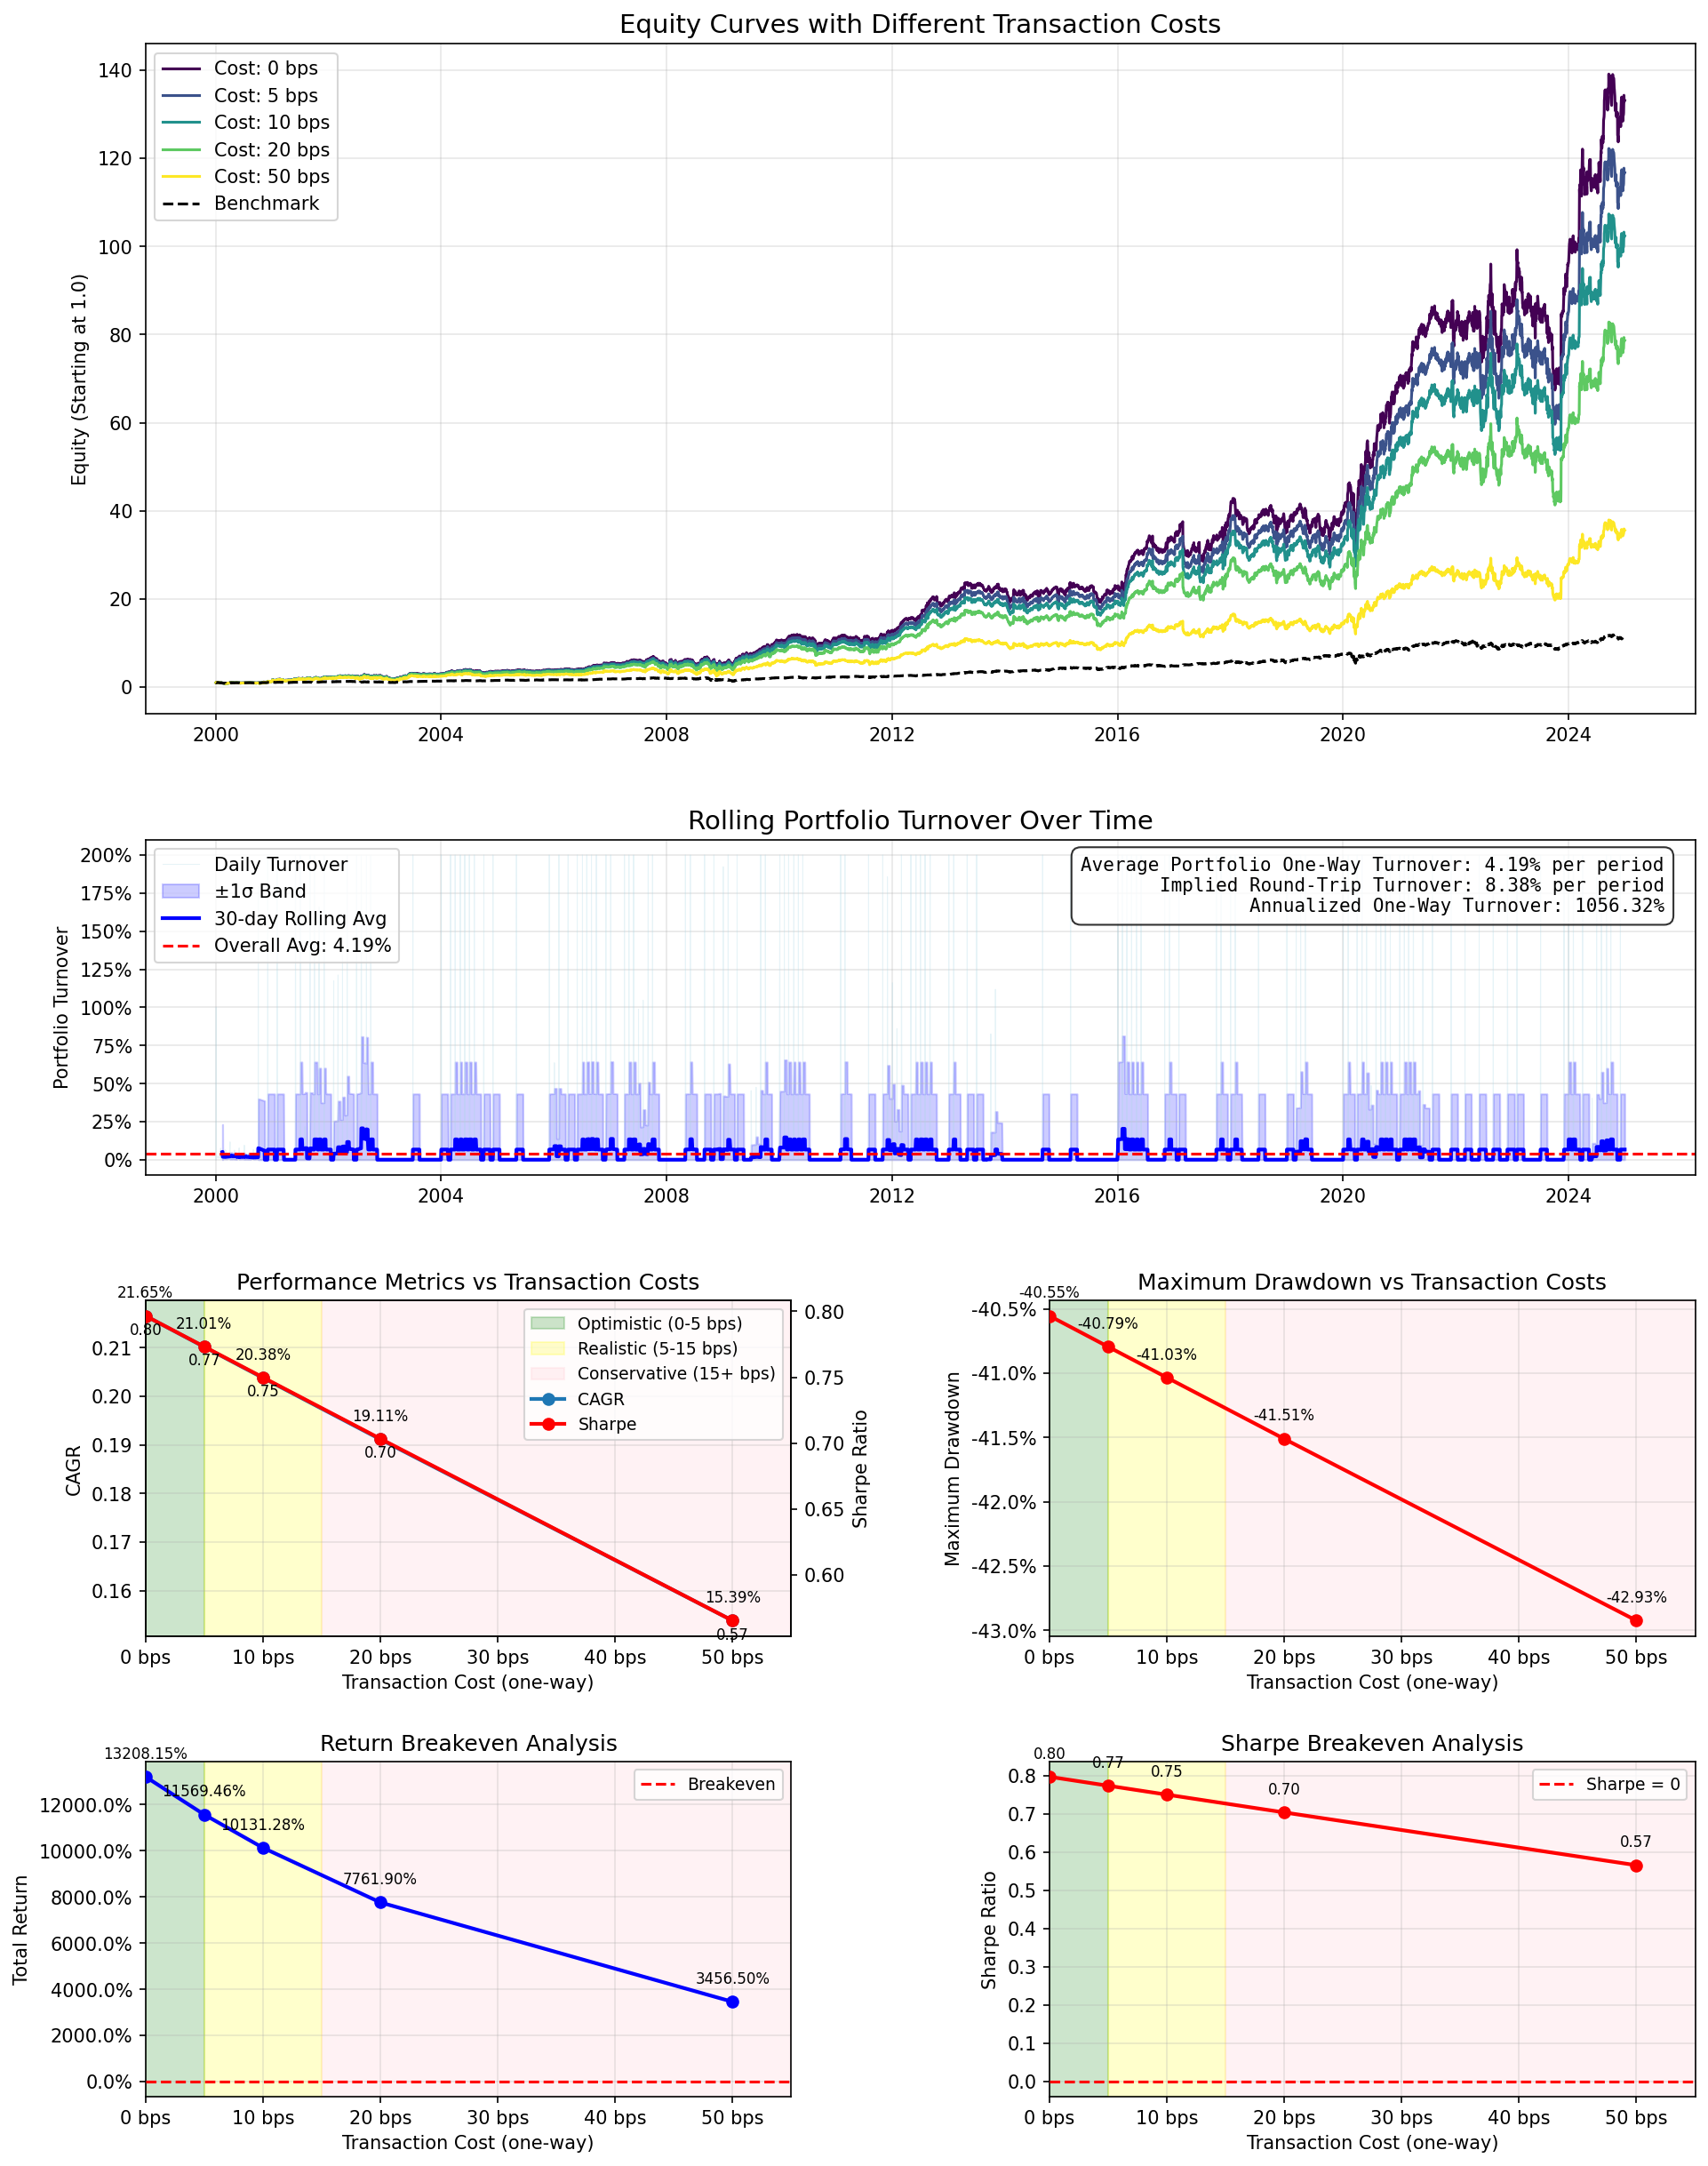
The evaluator output an equity curve visualization, transaction fee analysis, and the raw outputs for later evaluation if I wanted to do anything with them in the future.
For a a chunk of the strategies, there were, unsurprisingly, errors. So, I had to debug and fix certain things, consolidate the code, etc. Even after this, some strategies were just malformed and had to be tossed out.

After getting outputs for as many strategies as I could, I had folders upon folders of images that I manually cycled through. I ran each strategy on a single basket of assets (CL, KO, PG, PEP, MMM, TGT, JNJ, LOW, MDT, MCD) to maintain simplicity, and 8 configurations of lookback windows and rebalancing periods (7 day lookback with weekly rebalance with 30 day lookback, monthly rebalance, etc.)
If a strategy outperformed the equal weight benchmark consistently for each of the configurations, it was kept. I tossed the rest. I was left with 259 strategies.
I then ran PCA analysis to understand how similar the strategies were. I found that 80% of the variance could be explained by just 14 systems, which is extremely concentrated. Note that there are 2070 strategies in this example because each parameter run is a seperate ‘strategy’ in this case.

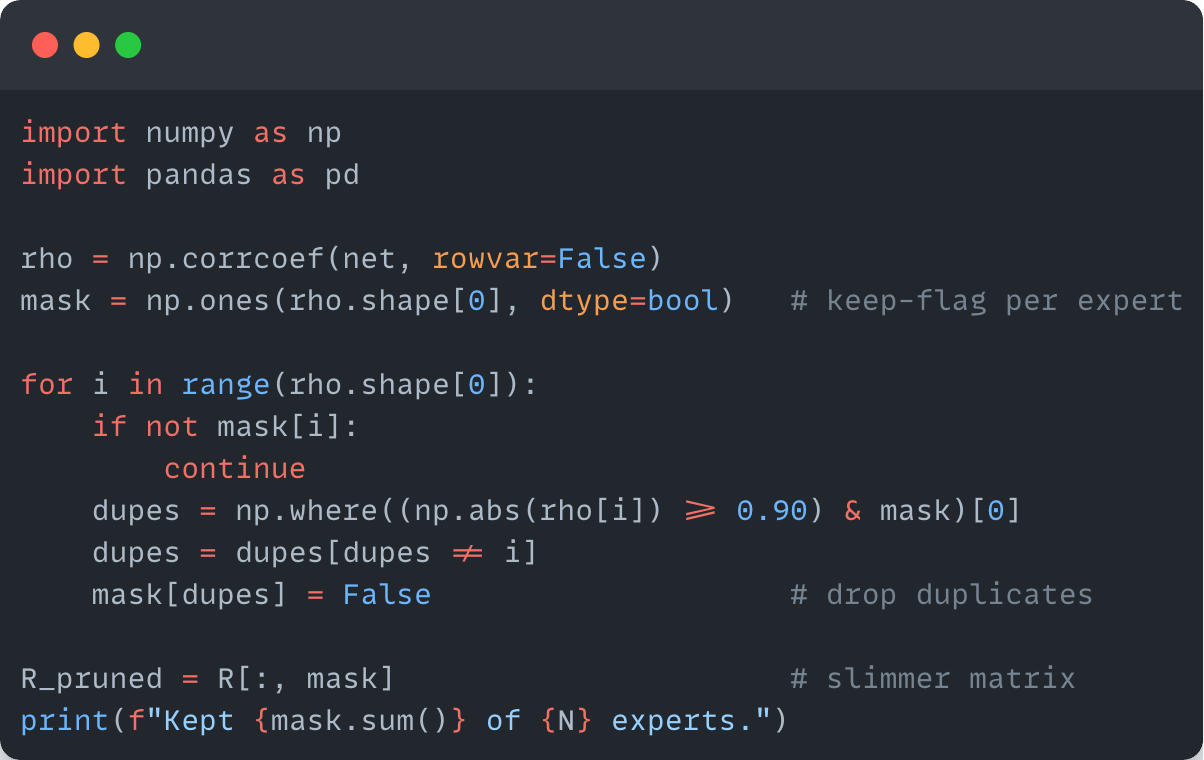
To get rid of duplicates, I just ran a simple correlation filter to get rid of the highly correlated systems. A more sophisticated approach could have been taken that looked deeper into the PCA results, but this was good enough for me.
The final result? 164 kept strategies. 18.75%. Here’s how they looked.
The Strategies
The finalized strategies fell into the following categories with mean reversion and momentum being the most present. This is not surprising as the base models I used to create this meta-system used those two factors specifically.
Mean Reversion Strategies
Prices are expected to revert to a central tendency after deviating.
Trend Following / Momentum Strategies
Prices are expected to continue in their current direction.
Moving Average Based Predictions (Direct Forecasting)
The MA itself (or a projection from it) is the price forecast.
Statistical & Time Series Modeling
Employ formal statistical models to forecast prices.
Signal Processing & Filtering Approaches
Apply filters to denoise price series or identify dominant frequencies.
Pattern-Based & Event-Driven Strategies
Predictions triggered by specific chart patterns or events.
Cross-Sectional Relative Value & Statistical Arbitrage
Exploit relative mispricings or co-movements among assets.
Volatility & Range Based Strategies (as primary drivers)
Use volatility or price range characteristics directly to make predictions, not just for band construction.
Top 3 Strategies
Out of all 164 strategies, three stood out as clear winners, all achieving over 20% CAGR on monthly rebalancing strategies, which is extremely robust.
SquaredDiffMean
Predicts price movement based on the normalized difference
(SMA - EMA) / current_price. Predicted price =current_price * (1 + (SMA - EMA) / current_price). If SMA > EMA, implies upward prediction.Hyperparameters
90-day Lookback
Monthly Rebalancing
CAGR with fees: 21.80%

EntropyDivergence
Calculates the Shannon entropy of an asset's returns. Low entropy suggests a trend, leading to a momentum-based prediction. High entropy suggests noise, leading to a mean-reversion prediction towards the moving average.
Hyperparameters:
90-day Lookback
Monthly Rebalance
CAGR with fees: 20.95%

RecursiveEnvelope
Recursively updates an envelope's center (EMA of current price with
alpha) and its width (EMA ofrecent_vol / centerwithalpha). Predicts the current smoothed envelope center.Hyperparameters:
180-day Lookback
Monthly Rebalancing
CAGR: 20.38% with fees.
The Complete Catalog
For easy browsing, I created a simple static site that has the precomputed backtests of all the strategies for each of the timeframes. You can view all 164 strategies with all their 8 hyperparameter sets. Paid subscribers get access to every single strategy’s code in the private Google Drive repo.
You can view the catalog by clicking the button below:
If you enjoyed this post, make sure you subscribe for more great strategies and trading content right to your inbox. Your support means everything to me. Thanks so much! And for paid subscribers, the code is in the private drive:

Happy trading and research!
Excellent work; I have done somewhat simpler loops before the age of AI, and they added value as learning foundations.
I have some ideas where you could take this for likely much better alpha, if you want to chat at some point.
Amazing content haha🤙
I’m also curious on how u set position size for ur strategy, look forward to that !