

I Used AI for 30 Minutes and Discovered 8 New Market-Beating Systems
Using LLMs to generate novel and new Online Portfolio Selection systems.


Everyone either naively thinks that an LLM will find alpha for them, or equally naively thinks LLMs cannot develop their own systems with any sort of edge. The reality is quite the opposite. When used properly, LLMs can supercharge your strategy research process by at least 10x. Those who aren’t using AI in their development workflows are going to be easily smoked by those who are in the next two years.
In this article, I’m going to outline how I broke down my last two strategy posts (OLMAR and LOAD) and used AI to come with completely new online portfolio selection algorithms. And the best part? It only took me 30 minutes.
But get this:
Some of the algorithms the AI developed performed better than the original algorithms themselves which were designed by state-of-the-art researchers. AI is no longer for toy problems and cute results.
Generalizing the Portfolio Selection Algorithm
I noticed that the OLMAR and LOAD algorithms were basically the same thing after writing both of my articles. Both of them use ‘price relatives’ as input features. Both of them create some sort of ‘forecast’ or scoring function for each asset based on technical features. Both of them project those scores onto a simplex (a list of weights that adds up to 1, or 100% of a portfolio).

I realized that the core of each of these algorithms was simply the ‘forecast’ or scoring function. The rest of them were exactly the same.
In the case of LOAD, that scoring function is:
If the slope of the last X prices is positive, return the percentage difference between the rolling maximum price of the asset and where the asset is currently trading.
If it is negative, return the percentage difference between the moving average of the asset and where the asset is currently trading.
In the case of OLMAR, that scoring function is:
The percentage difference between the moving average of the asset and where the asset is currently trading in all cases.
Those percentage differences are then projected on a simplex, which could also simply be conceptually seen as the proportion of the summed returns each asset is projected to achieve.
Thus, I created an abstract OnlinePortfolioSelectionAlgorithm that provides a single function to implement: the scoring function. So, I only needed the AI to come up with new scoring functions to plug in and the rest would work as expected.
Making the New Systems From Thin Air
It was brilliant. I now had a shell of a system and I just had to have Claude come in and fill in a single function.
So, I figured to ask the AI to come up with 15 different strategies. I was pretty broad, but I could have gone a lot deeper. For example, 15 focusing on seasonality, 15 focusing on momentum, etc. etc. However, I asked Claude:
“Now we have a nice abstraction. We now can experiment with different `predict_prices` functions. Come up with 15 different predict_prices functions that you think could work.”
In which Claude happily responded:
Here are 15 different
_predict_pricesfunctions that could work within our online portfolio selection framework:
1. Weighted Moving Average (WMA)

2. Double Exponential Moving Average (DEMA)

3. Bollinger Bands Mean Reversion

… and 12 more listed here for brevity:
Linear Regression Forecast
Relative Strength Index (RSI) Mean Reversion
Momentum-Based Prediction
Pattern Matching Prediction
Mean Reversion with Volatility Adjustment
Ensemble Method (Multiple Models)
Cyclical Component Analysis
Adaptive Breakout Strategy
Volatility Breakout
Price Gap Analysis
Support and Resistance Levels
Seasonal Pattern Recognition
Claude not only came up with 15 system ideas, it did so and wrote the code. In all cases, the code had no bugs. Did the systems all work? Of course not. But that’s not the point. With AI, we’ve automated the generation of ideas and we have a very simple way to tell if an idea is ‘good’ or not.
Imagine having an AI agent making iterations and generating _predict_price functions all day and then filtering out the top 1% of the 1000s it generated? That’s where the true power takes place.
The Final Results
So, of course, the logical next step was to try all of them out. Spoiler alert: some didn’t work. But, the one’s that did worked very well.

Here are the two baseline systems, OLMAR and LOAD, compared against the AI generated ones. I only selected systems that performed well. All systems are using the same basket of assets: CL, KO, PG, PEP, MMM, TGT, JNJ, LOW, MDT, MCD, the same window (180), same epsilon (10), and are rebalanced every month to lower transaction fees.
All of them perform well and several outperform our base systems. A lot of them show correlation to each other, so there are similar factors being taken advantage of.
The best performer, MeanRevMom, is a combination of mean reversion and momentum, scoring both of the factors together into a single blended number.
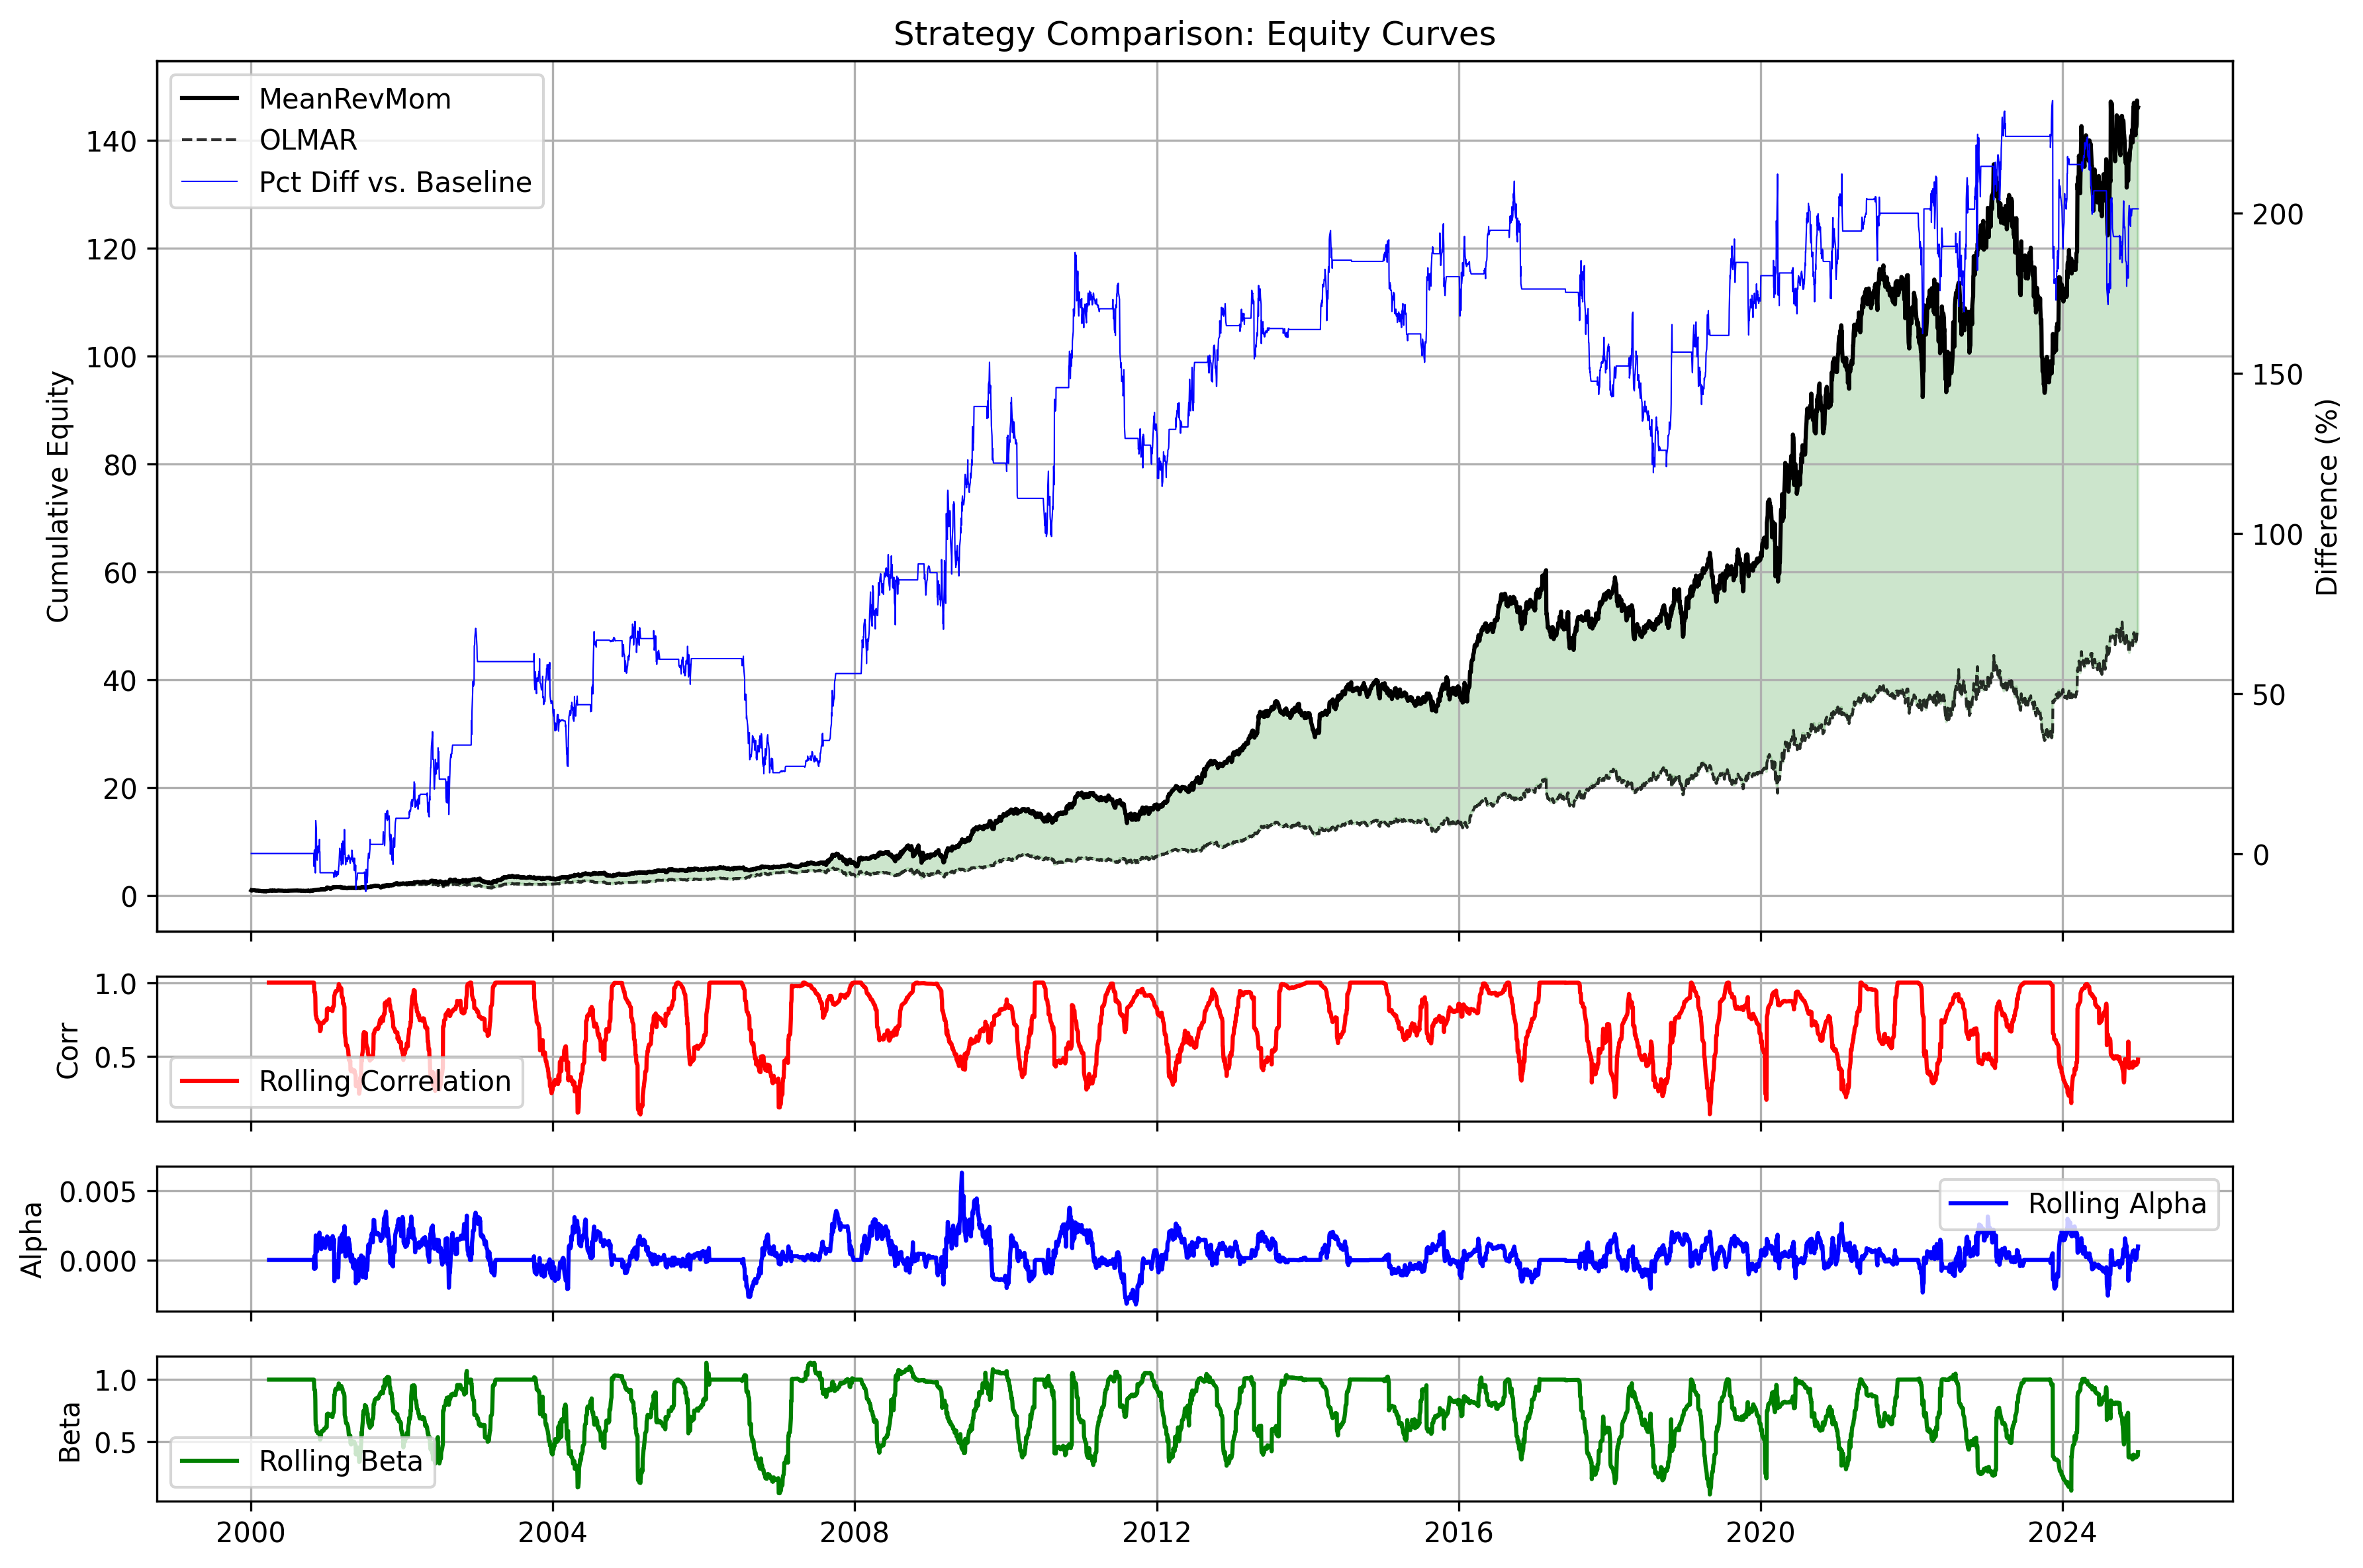
MeanRevMom vs OLMAR
Against the baseline OLMAR, MenRevMom returns about 200% of the performance over 24 years. It is still based on moving averages and mean reversion, like OLMAR, so we have points where the two strategies are doing the same thing and equally correlated. However, there are many points where there is divergence in the strategy, indicating the dynamics of the system are different enough to consider it a bespoke system.
MeanRevMom Transaction Fees
Due to the long window and monthly rebalance, these systems are pretty impervious to transaction fees. There is not much turnover occurring. You get 20% CAGR with this even at 10 bps. At 20bps, you still get around 18.5% CAGR.

Going Even Further
The next step would be to develop an automated AI agent that develops and spits out these tearsheets for a ton of different algorithms. Google just released an LLM research system called AlphaEvolve that uses evolved prompts to come up with new solutions to software problems.

You could do something similar here, or have an LLM spit out 100 different concepts and refine the best ones. For example, MeanRevMom scores both factors 70/30. But, perhaps, the optimal split changes over time. Maybe sometimes we would have made more money with a 60/40 or 50/50 split.
We could have an LLM create an adaptive blending system that moves the factor blend towards the blend that best fits so that during different market regimes, it is capturing the most amount of upside.
Now You Can Create Your Own Systems
With this code, you can simply have ChatGPT, Claude, or Gemini produce a myriad of strategies for you and then test them all in a highly robust and quick way. Bonus points for whoever can use agents to fully automate the creation, validation, and optimization of new ones.
You now realize that LLMs aren’t just some overhyped fad that spit out garbage trading strategies or the magic sauce that produce alpha with no direction. This approach empowers you to become 10x more productive in your alpha generation process and leap ahead of your peers.
Go forth, and generate!
Next Steps & Getting the Code

The code in the private repo lets you start generating online portfolio selection systems today! Just go to the private Google Drive and download the code! Don’t have access? Become a paid member today!
Try It Yourself
Grab the full Jupyter notebook, including live data loaders, visualization cells, and the production-ready
OLMARStrategyimplementation.Tweak your own baskets—whether it’s tech, dividends, or global commodities—and see how the system balances them in real time.
Join the Inner Circle
Paid subscribers get immediate access to the private Google Drive, where you’ll find:
The complete
OLMARStrategymodule for Portwine.Visualizations and analyzers not included for free subscribers that you can use in your own systems.
Access to the archives of all strategy code from all previous posts.
Thanks again to all my subscribers, paid or free, and happy researching!