


The Moving Average Zoo: An Interactive Lab for Strategy Optimization
Going from technical to creative in quantitative research.


Quantitative research is marred by directories of data, long-winded mathematical models, and Jupyter Notebooks that plot out charts of raw statistical distributions.
However, people are visual creatures. Our research process can be made a whole lot better through creative UI design and more humanistic factors.
Using better tools and systems that account for our visual nature improves our research process drastically, and above the processes of our mathematical peers.
Here’s what I did:
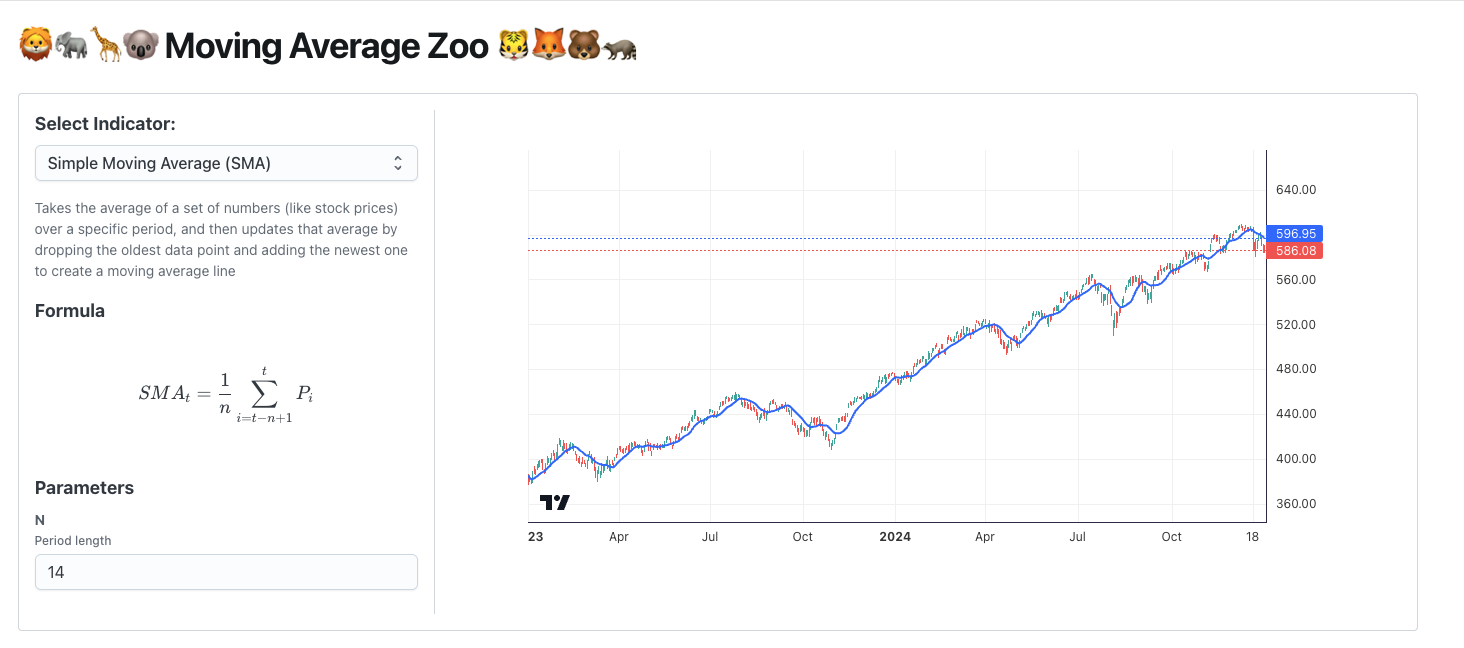
Using React, a simple component library, and Cursor, I was able to build a super fun, interactive site that lets you explore 50 different moving averages and how ‘good’ they are when applied to a strategy.
Want to just check out the app? Click on the button below and play with it now!
Let’s get started!
Dealing With the Status Quo
Most research begins with an idea: ‘what if?’ We then go through the scientific method to prove this hypothesis.
“If I enter a trade when the RSI is at 30, do I generally make money?”
“If I rotate my capital into the top 3 stocks in this ETF baskets based on momentum, can I beat the market?”
Etc.

However, these hypotheses are targeted. When we are proving or disproving something, we are extremely precise.
“No. RSI entry based points are a bad indicator for my timeframe and assets that I trade.”
“Yes. Using momentum to rank assets in a basket generally gives me more upside than the general market.”
Likewise, how we prove or disprove these theses come down to the nitty-gritty of data processing. It’s about the numbers.
Where Things Break Down
So, for targeted questions, this type of research is great. But what about the ideation phase? What do we do when we have no hypothesis?
We can do large parameter sweeps and amass massive amounts of data, CSVs, Matplotlib charts into folders and click one by one until we find a configuration that looks interesting. But, this is not it. Something is missing.

User experience design (UX) has a concept of Browsing versus Searching when it comes to interface design.
Imagine an online store. If you know what you want, you just need to type it into the search box and boom. It’s there on your screen.
But what about when you don’t know what you want? Well, that’s when you browse. Having the ability to look at all the content and select what you want when you are pulled into it is key in any shopping experience (or online blog, streaming service, social media platform, etc.)
Browsing With Data
So, taking this concept and applying it here, we search when we know what we are looking for. We search when we have a question that needs to be answered. We refine and compare our search with our data and using the scientific method.
We don’t have our browse path established. Let’s do that now.
I have 50 moving averages that I want to compare. I want to see which ones are the best. How well to each track the price of the asset? How well do they smooth out the signal? Are there outliers?

All of these factors I can extremely quickly glean from a chart.
How can I answer all of those questions with data? How do I define ‘the best?’ How do I define ‘smooth?’ What if my definitions of those things change over time? Today I want something that is more smooth over accurate. Maybe tomorrow that changes.
I don’t want to have to redefine my humanistic requirements for a computer to only then have to translate what the computer spits out back into my humanistic requirements.
Building the Zoo
My solution was to build an interactive application that let me visually play with 50 different moving average indicators, their parameters, and test on mock strategies which ones are ‘the best.’
My task list:
UI
Dropdown selection of the moving averages
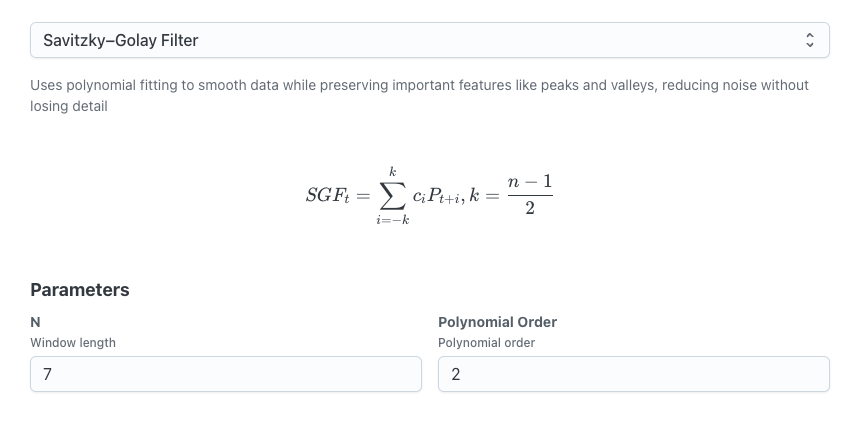
Dynamic loading of parameter inputs for each indicator
Bar chart with indicator painted on
Strategy section for testing how ‘well’ a certain indicator did
Other bits
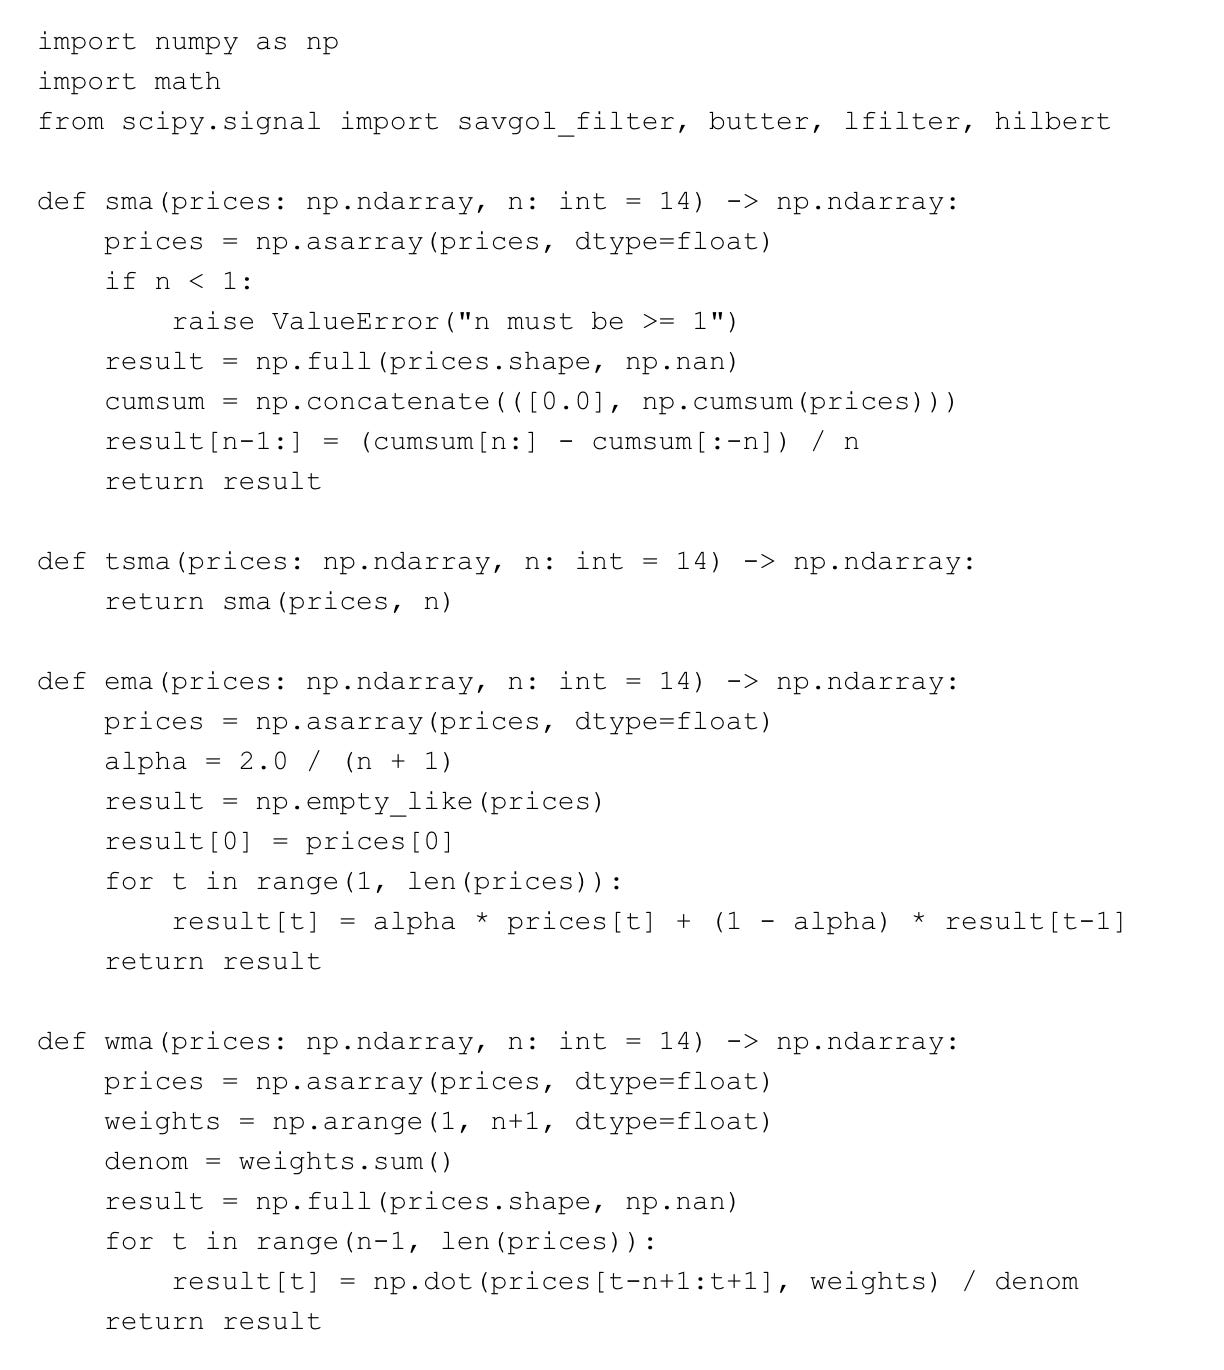
Implement 50 moving averages in Javascript
Design different strategies to test the signals on
Generate LaTeX definitions for all the indicators
I went with Cursor as my IDE, generating a new React project using Vite and Typescript. I also installed the MUI component library to make prototyping quicker.
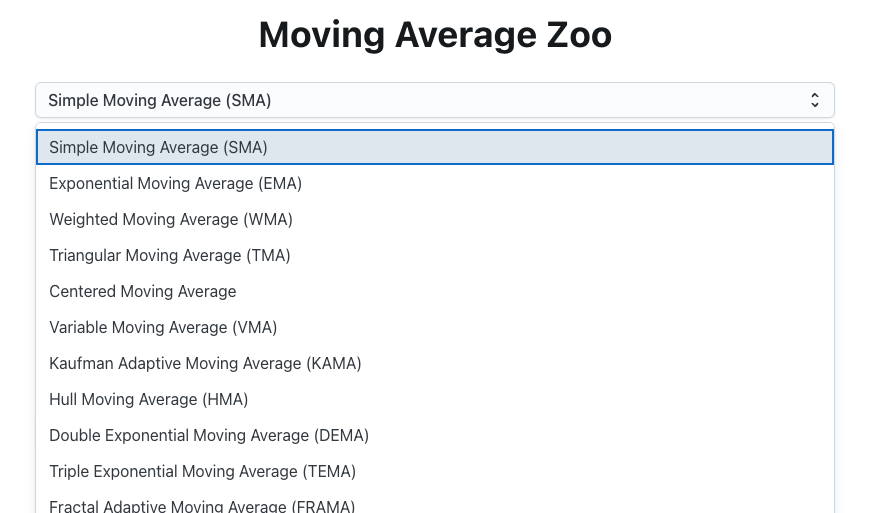
The first step was to populate a dropdown with the 50 moving average indicators I wanted to implement:
I then also coded the Javascript implementations of all the indicators, which informed me on which parameters were modifiable. I created a JSON file for all of the indicators and their metadata like so:
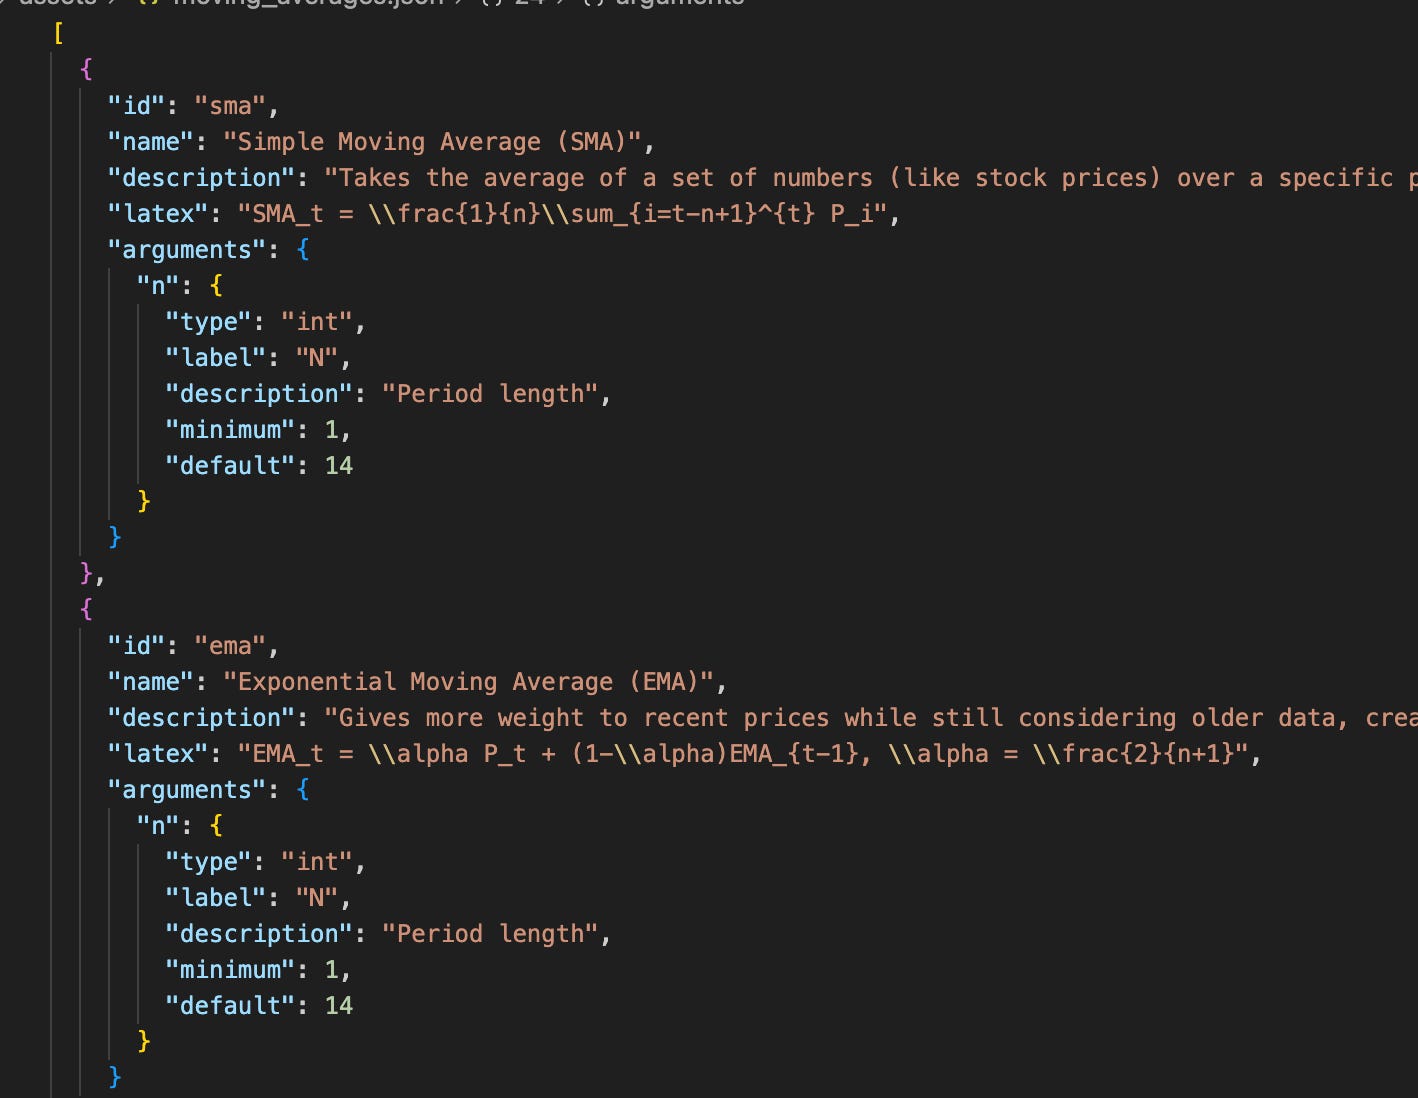
Which then allowed me to create a dynamic component for parameter entry depending on which indicator was selected by the user:
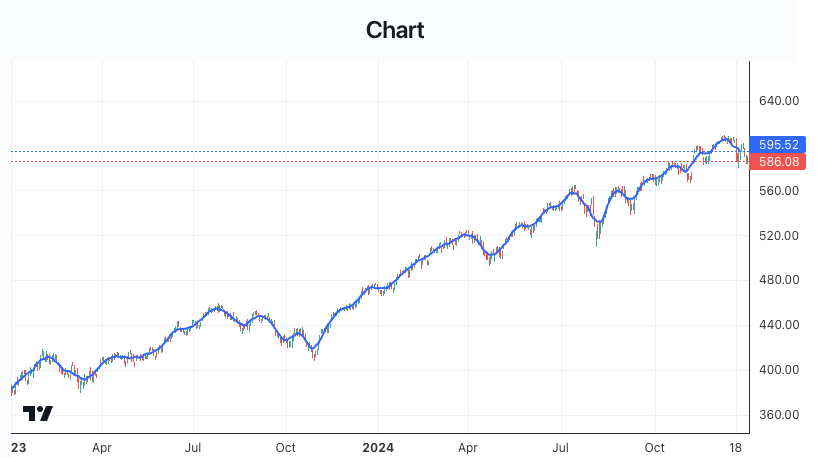
After this, I dropped in TradingView’s Lightweight Charts library and loaded SPY data onto a bar chart. Given the implementations of all my indicators, and the ability to modify the parameters, I could quickly update the chart with the new indicators without much hassel.
Adding the Strategy Backtester
So, I had a working application that let me visually play around with a ton of moving averages. I was already finding a lot of really good indicators that looked good to me: resistant to outliers, nice smooth curves, etc.
However, I imagine that another trader would come along and get their own inspiration.
I had successfully built the browser.
But, this wasn’t telling me how ‘good’ a moving average was. So, I decided to add a strategy backtester with certain stock strategies that used the moving average. I came up with the following systems that use a single indicator:
Slope Strategy
Long when the indicator slope is above X. Sell when the slope is negative.
Price Crossover
Long when price crosses above the indicator. Sell when it crosses below.
MA Band Strategy
Long when price is near the bottom of a band (calculated as X% width above and below the indicator). Sell when it is near the top of the band.
Momentum Strategy
Long when positive momentum of the indicator is strongly positive. Sell when it weakens.
Mean Reversion
Long when the price is X% deviations below the indicator. Sell when it returns to the indicator.
Volatility Breakout
Long when the price breaks above the indicator in high volatility periods. Sell on reversals.
Trend Following with Stop Loss
Long on an uptrend and attach a stop loss for sells.
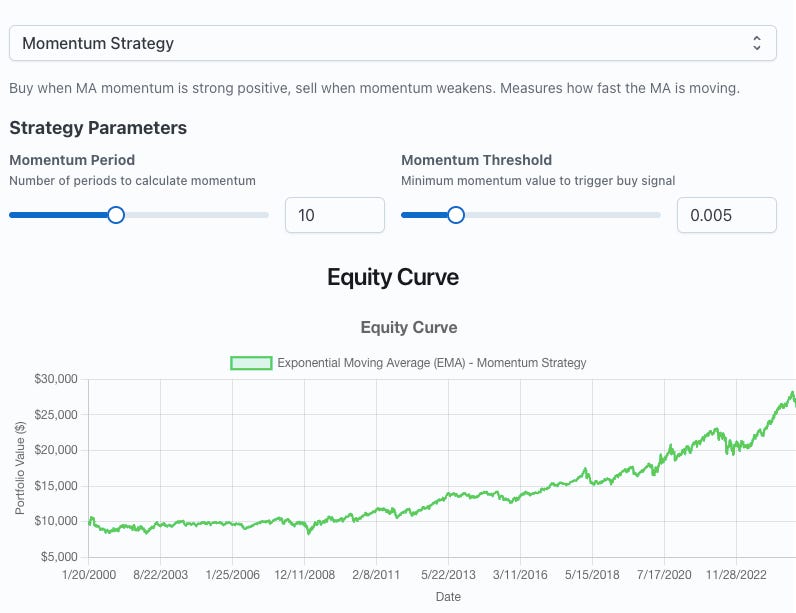
Like the indicator parameters, I coded dynamic components for the entry of the strategy parameters. I also added an equity curve, tear sheet, and trade list for further analysis.
Deploying It
Because I’m using a super standard stack: React, Vite, and Typescript, I can use a cloud application platform like Render. My build command is just npm install; npm run build, so I hooked it up to my Github repo and deployed it without any issues.
The Results
In the end, the zoo was complete. If you want to play with it yourself, click here:
You’ll be able to
Next Steps: A Full Sweep
Of course, this tool is fun. But it should be paired with some data analysis. The best setup is exploratory / browsing tools to find out the rough sets that work so you can use more rigid programming and analysis to figure out truly how to harness what you find.
You can also try building your own interactive applications. Maybe build one to highlight different regimes or to set buy and sell points to help you label your data for a machine learning pipeline?
Maybe a strategy blender tool that lets you upload your strategy returns as CSV files and use sliders to play with the ratios so you can come up with the best blend of each strategy based on what you want?
The world is wide and open. Have fun and experiment!
Code for the Moving Averages
The code for the moving averages is available in the Google Drive as a Python file. I will be experimenting with implementations in other languages soon so you can use these indicators in TradeStation, MultiCharts, TradingView, and MetaTrader.
I’ll also continue my research into moving averages and quantifying which ones are the best.
So, stay tuned, and thanks for the support!
Happy researching!
Amazing work. Love the pictures too. Keep it up!
Fantastic design - really just what I needed right now :) thank you