

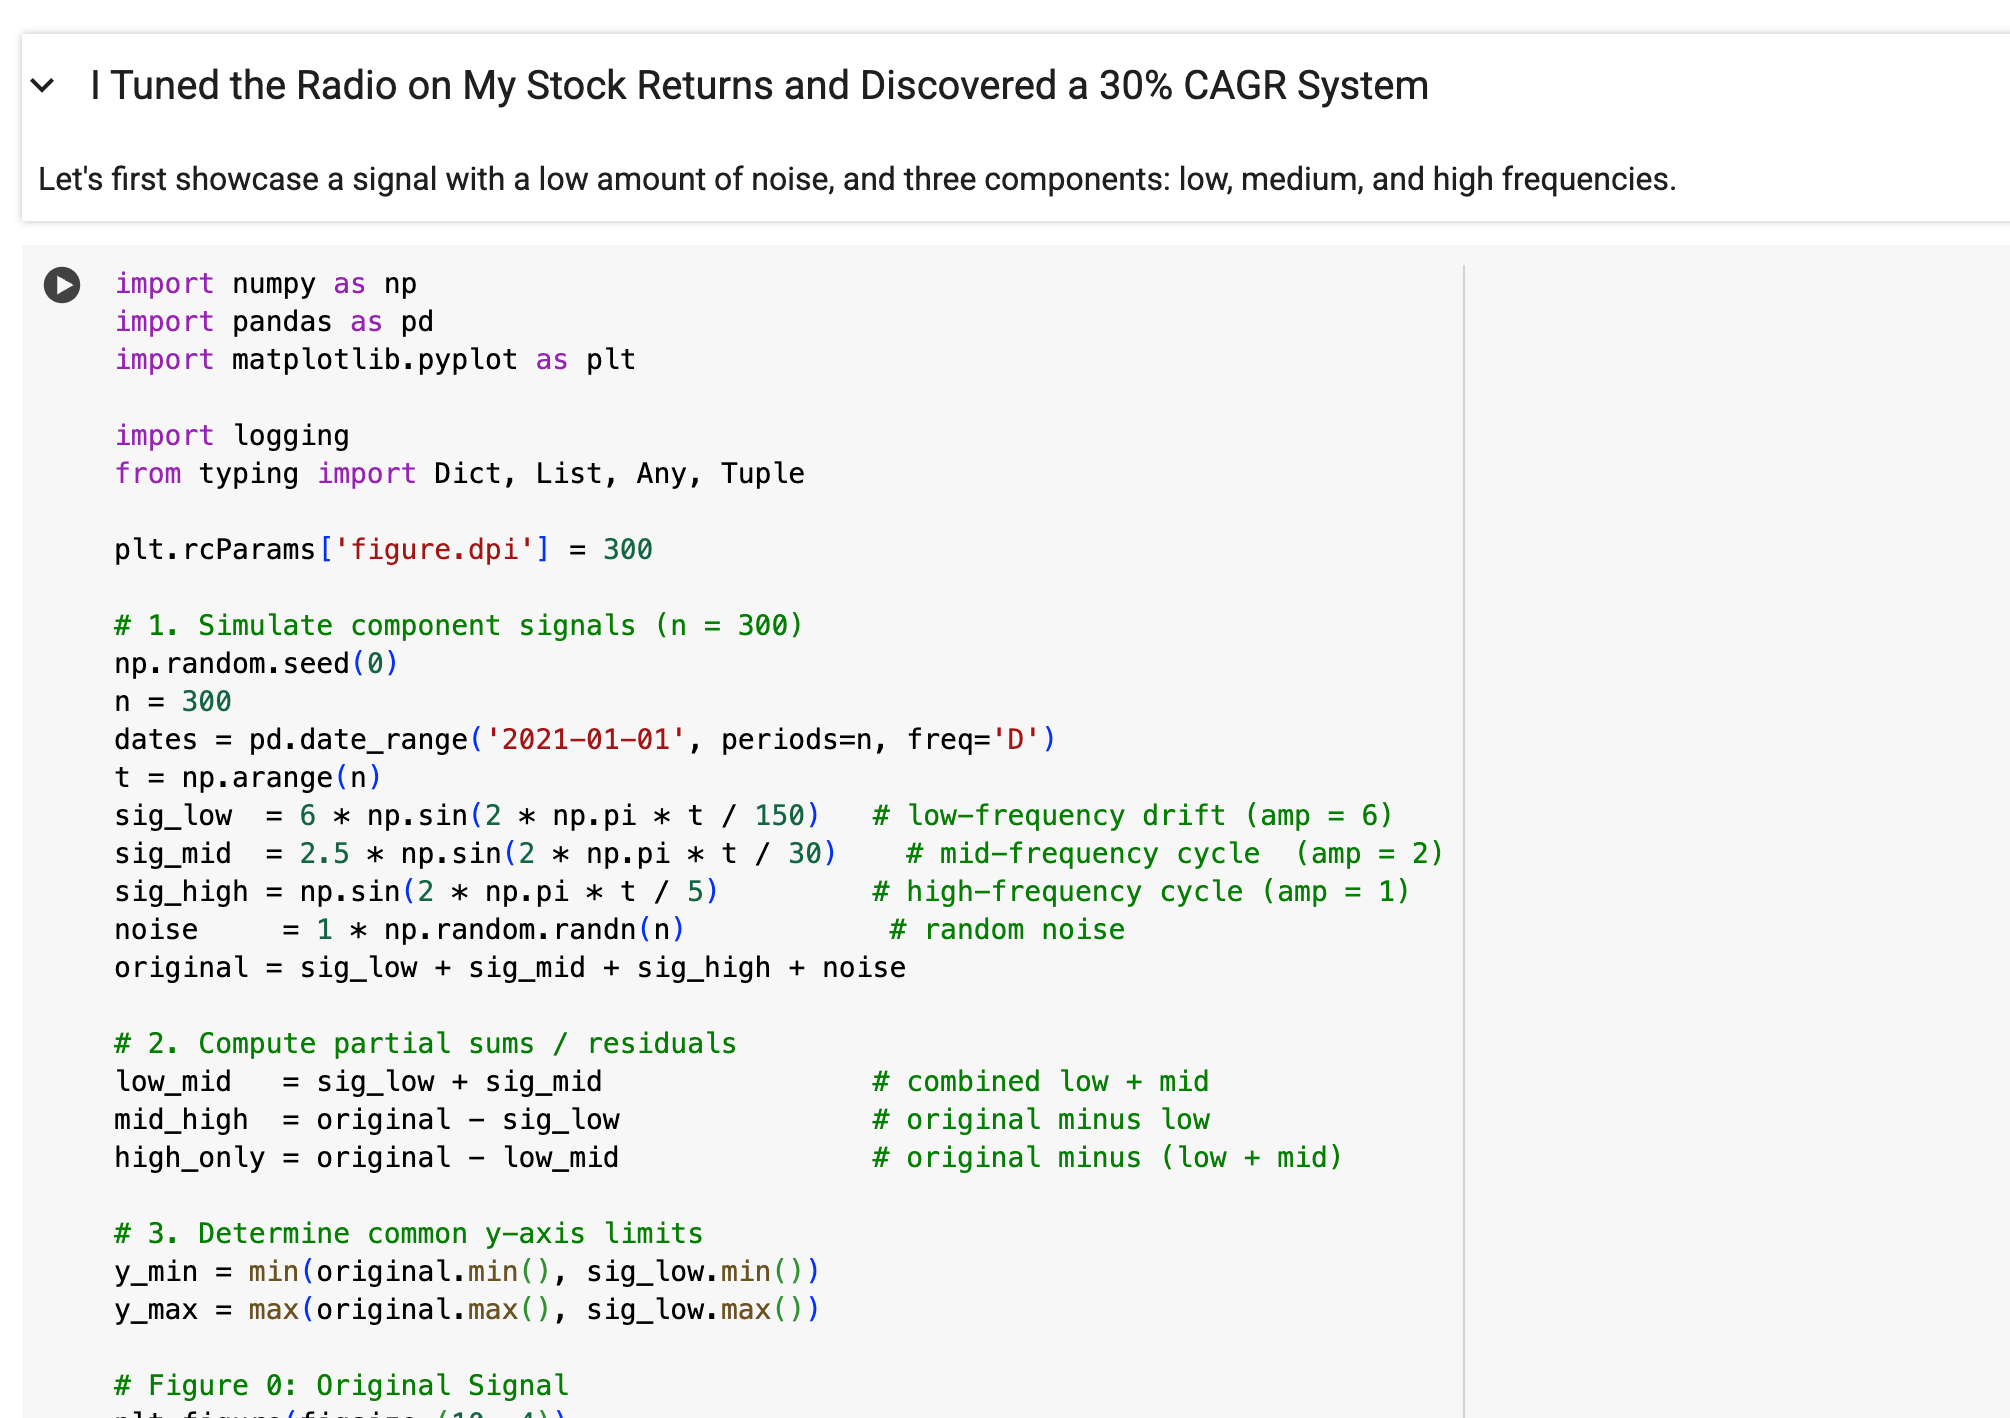
I Tuned the Radio on My Stock Returns and Discovered a 30% CAGR System
Finding success in the markets is just as easy as finding your favorite radio station.


It’s dated technology. The radio. But underpinning its humble origins is an electrical engineering field known as signal processing that has applications in literally everything around us: WiFi routers, making music sound better, and even detecting earthquakes.
While many readers may assume that I built my system with bespoke approaches tuned specifically for financial applications, the reality is that I am using the same basic algorithms that a regular radio still uses today.
The assumption of specialization and complexity leading to better results is an attractive folly. But, the opposite is more often true. If we are unable to control our biases as traders, we will never break away from the same cycles that keep us glued to our screens losing money.
Here’s the thing:
Not everything needs to be complex and overthought. Tried and true methods that make sense given the application will always outperform the state-of-the-art used in the wrong way.
I’m here to show you how, by following the lessons of my trusty old FM radio.
Turn on the Radio
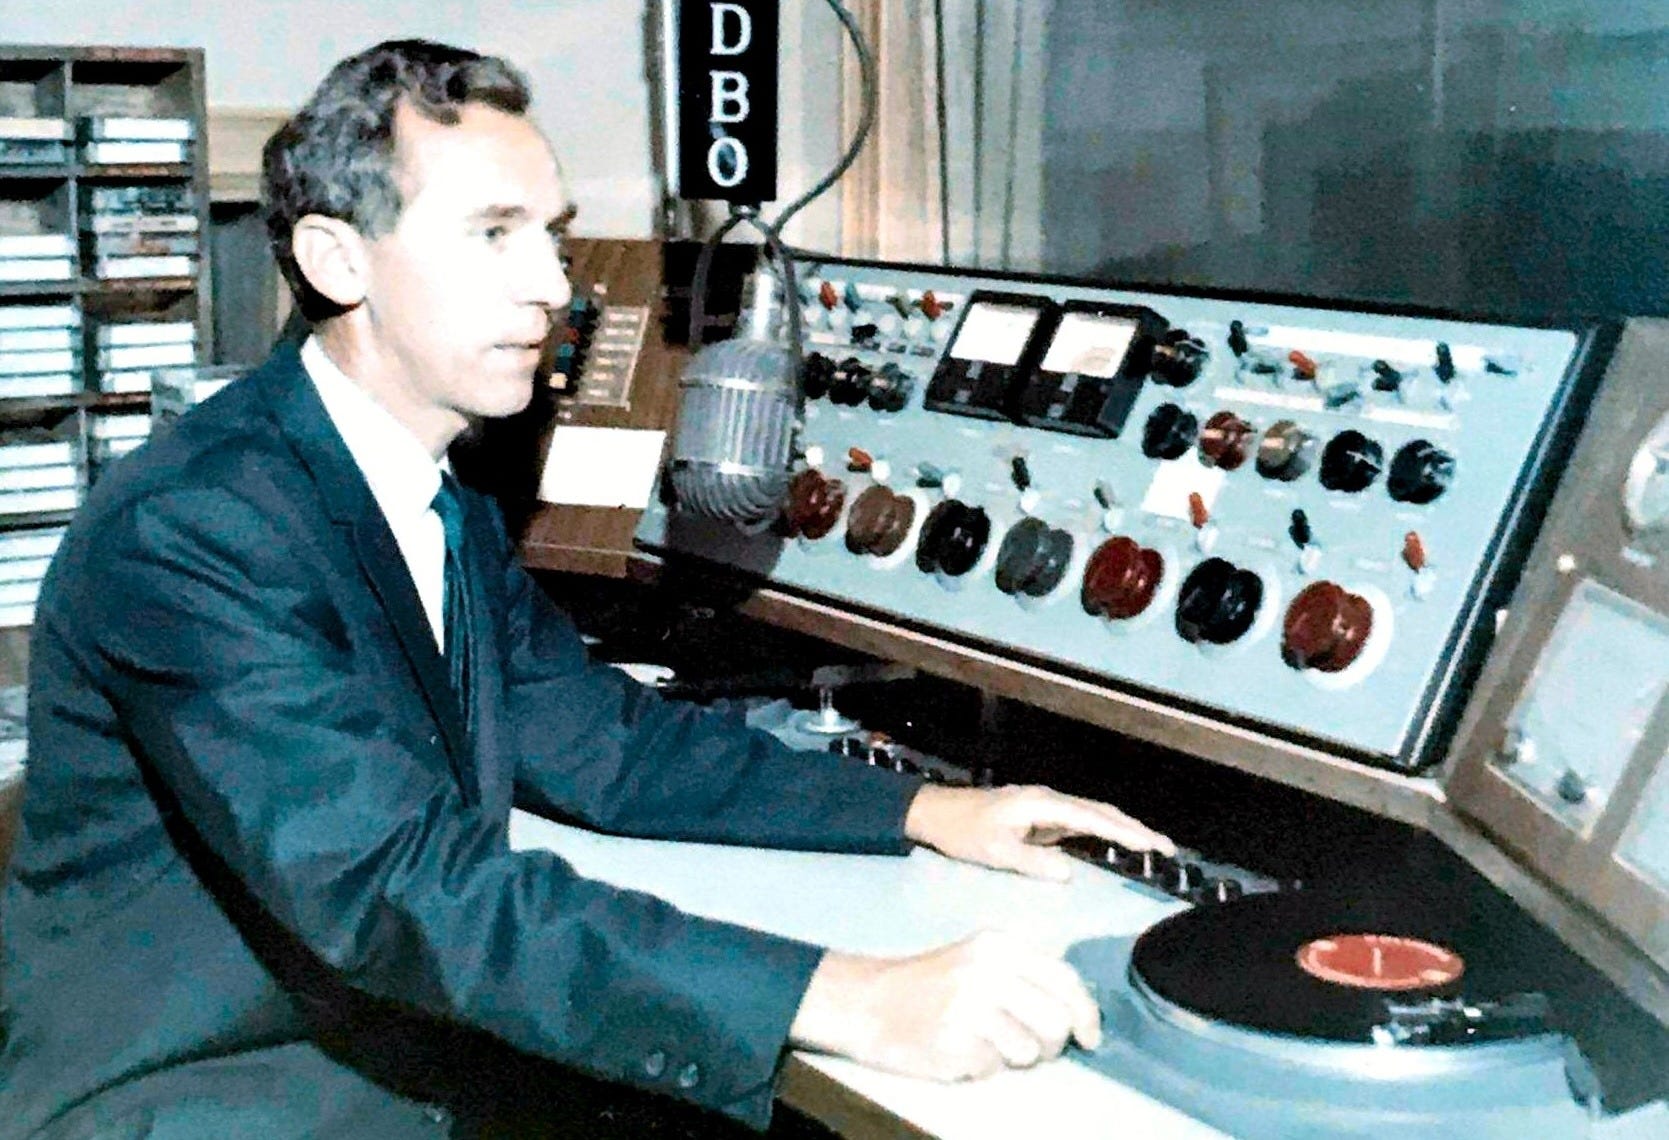
Imagine you’re a radio station operator in the 1940’s. Your job is to transmit only the finest news in the nation. You walk in with your three piece tweed suit on and flip on the power switch.
You grin looking out the window as the radio waves permeate across the great nation, with a glass of cold milk in your hand.

If you had the eyes of a mosquito (which actually sees infrared and not radio waves, but I digress), you may see these squiggly lines dashing across the room:
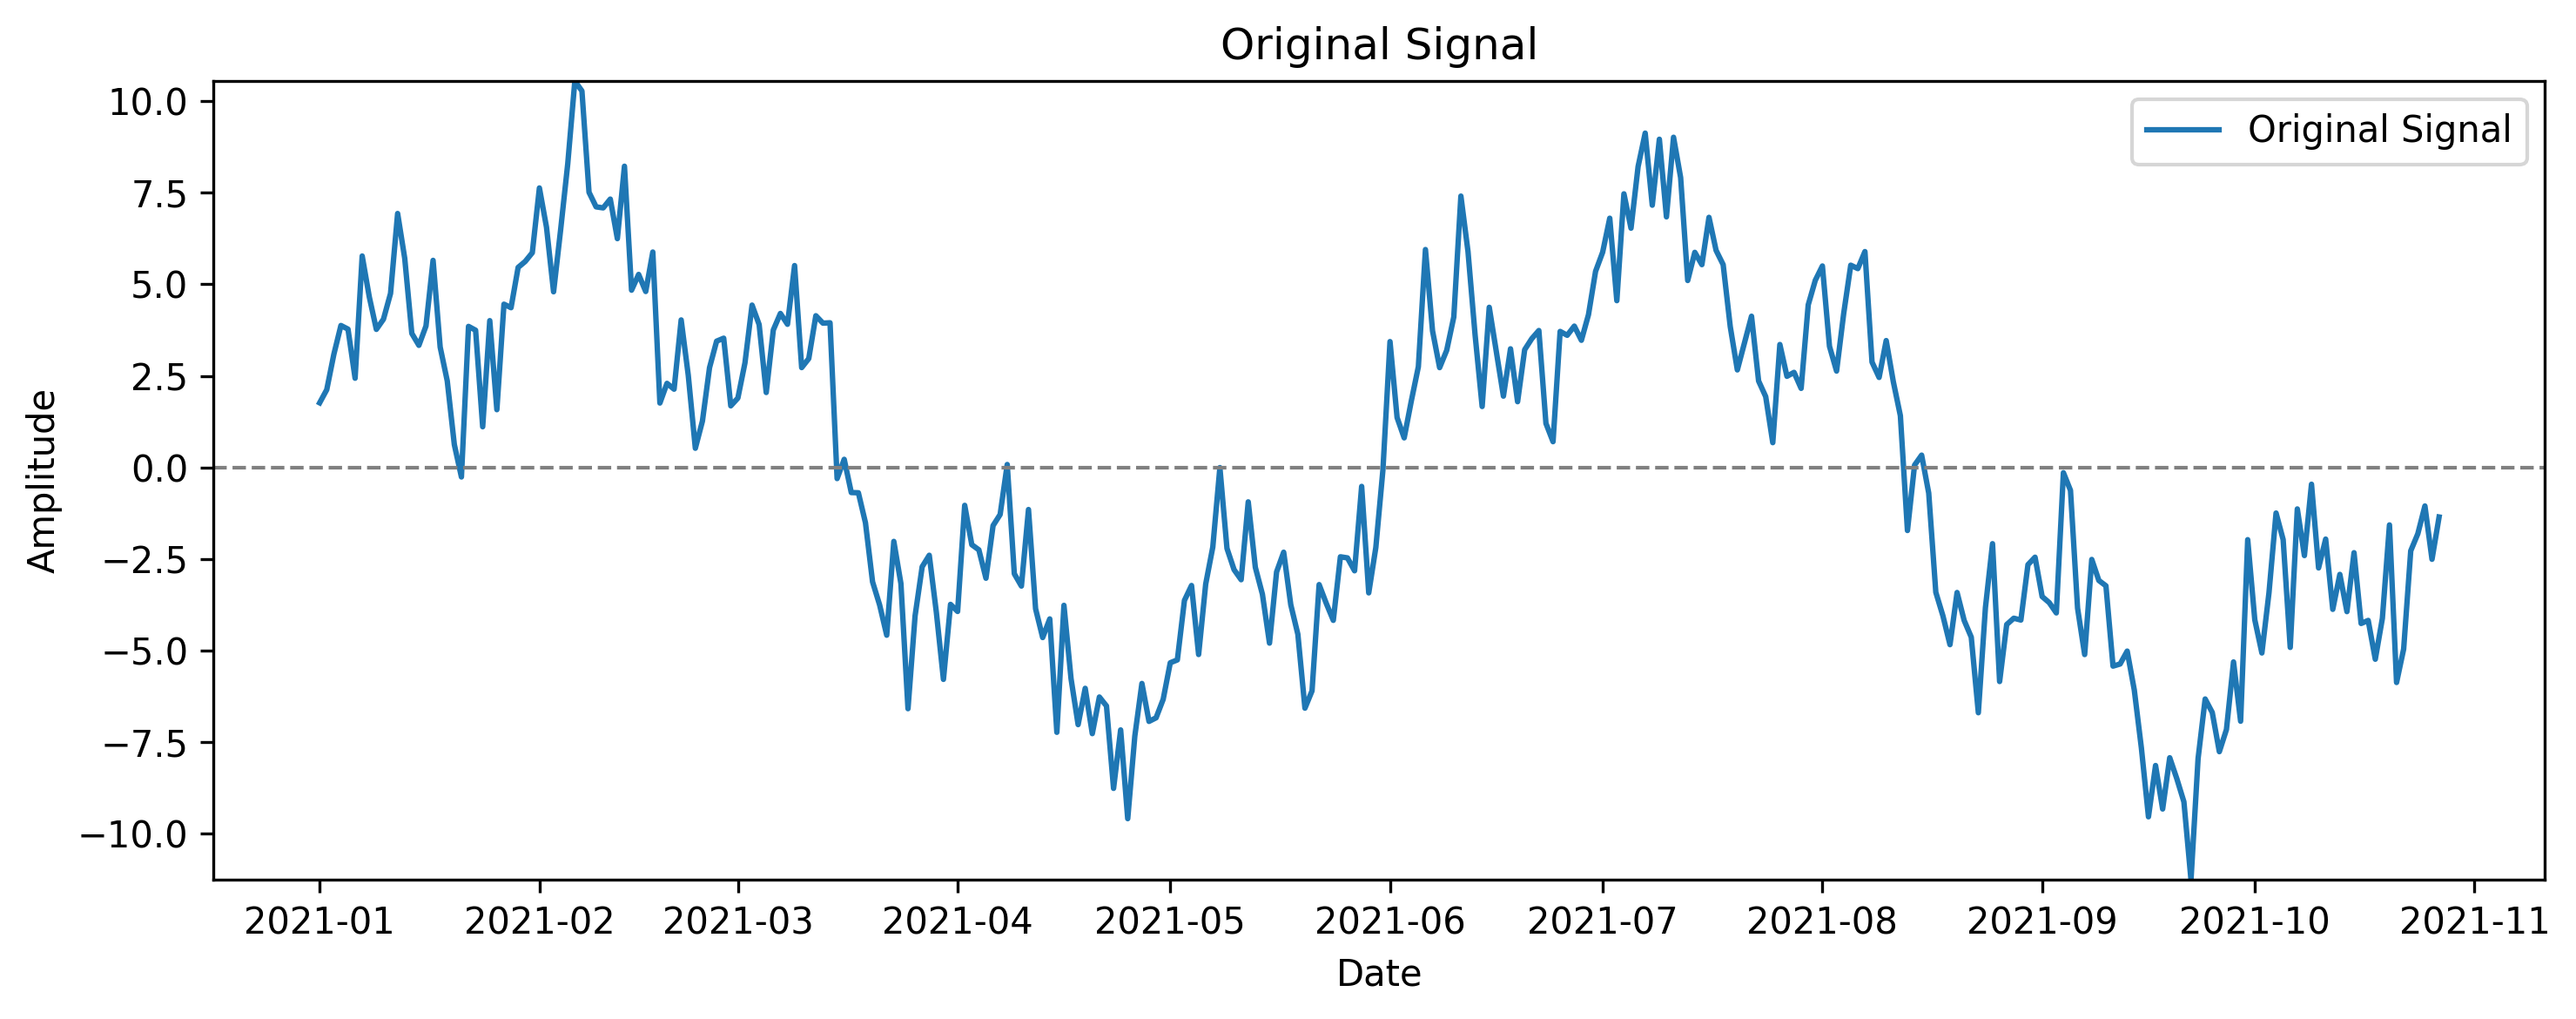
It looks complex at first. But, at second glance, you can clearly see that is made up of cyclical patterns. The first one is a very long cycle going up and down, like this:
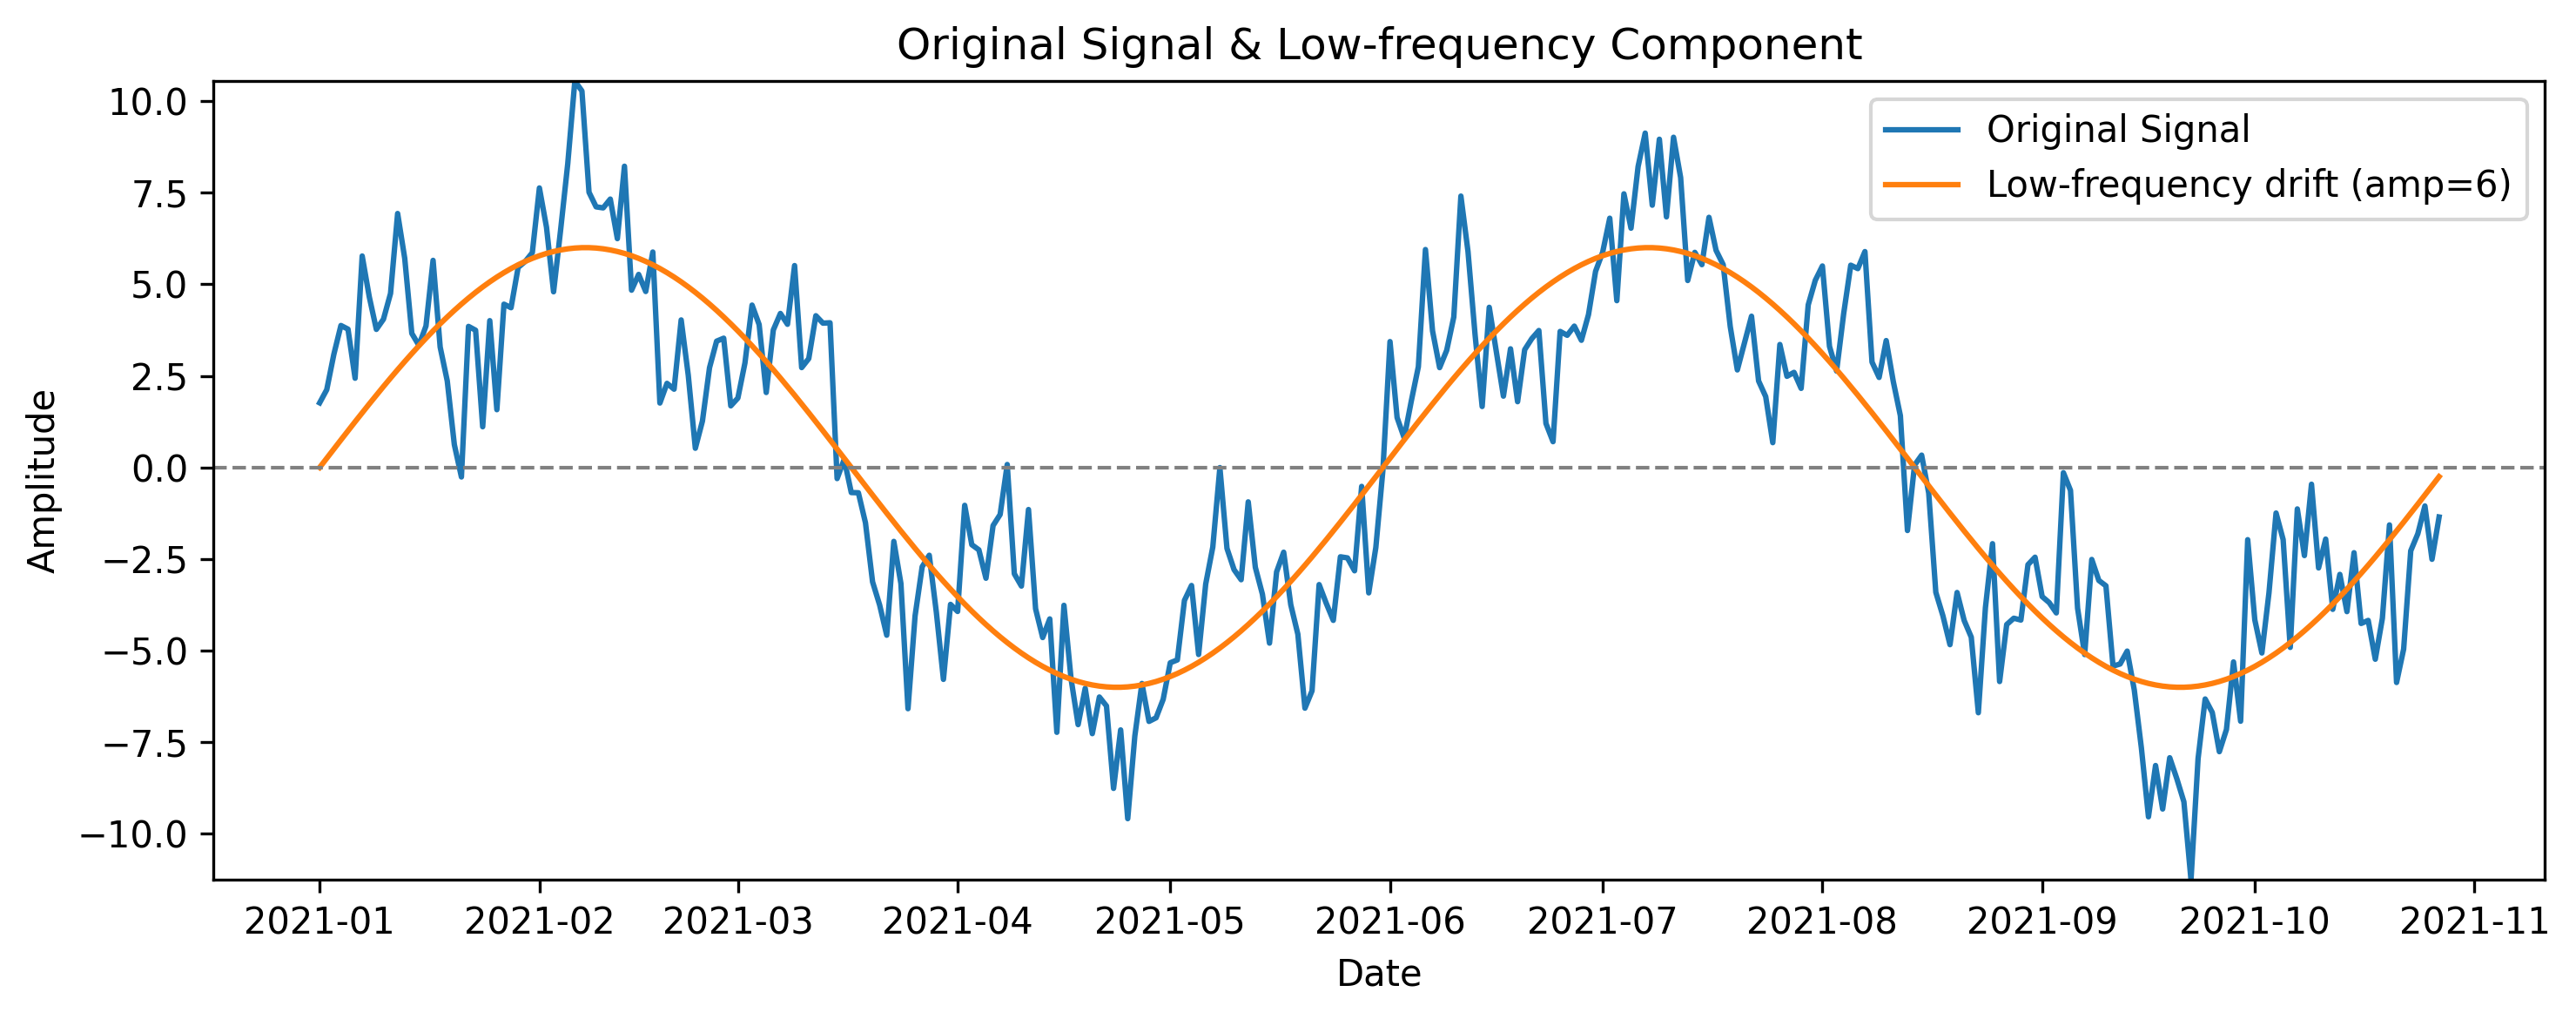
But there also seems to be a second component and trend in this wave that is a higher frequency. I added that shorter frequency to the smoothed trend line below:
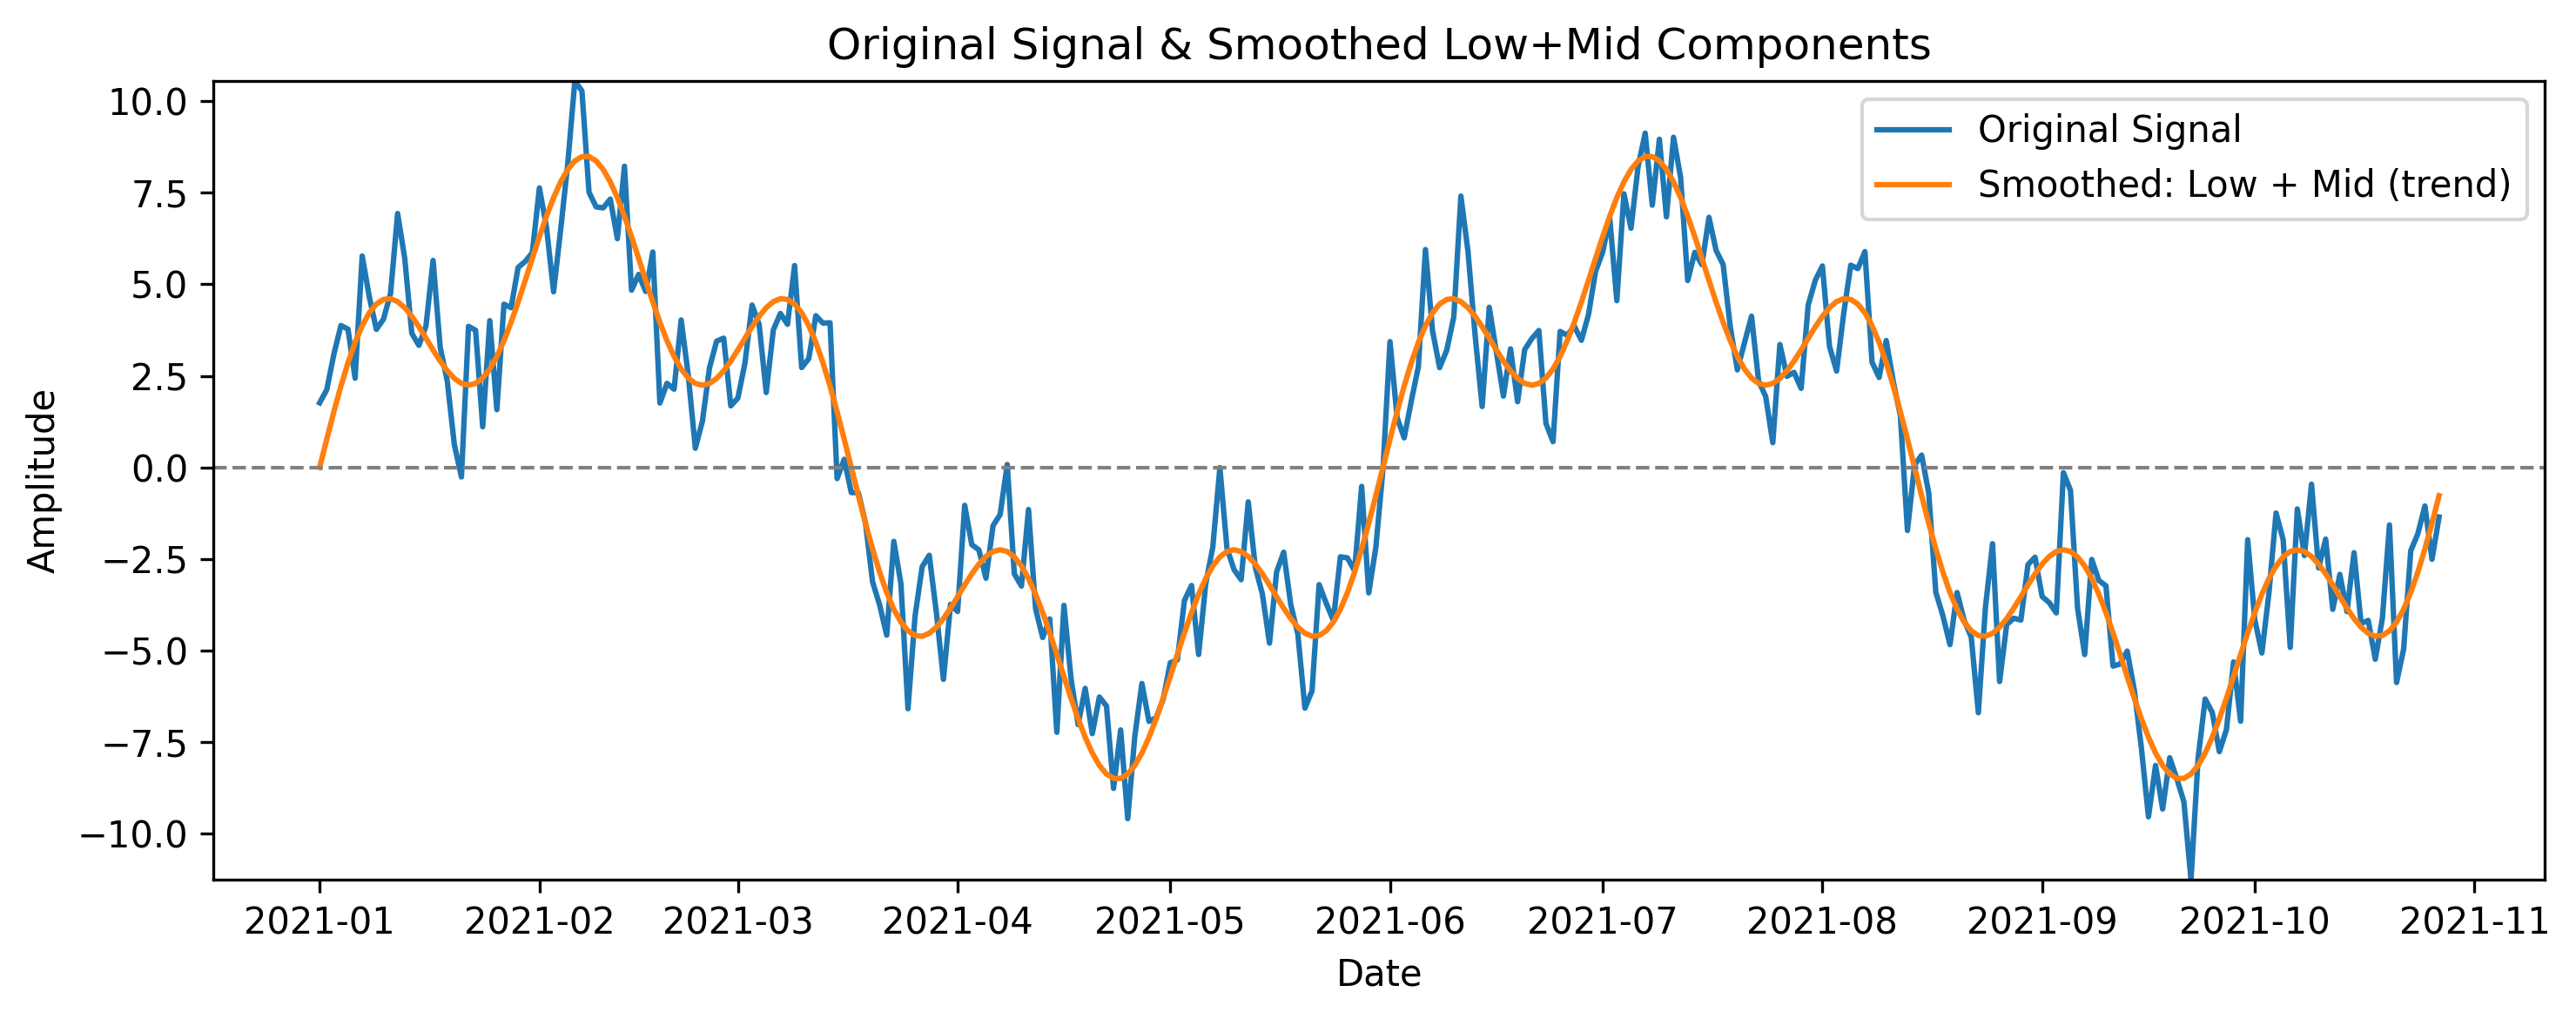
We are starting to break this wave into its components or trends. This breakdown illuminates to us the cyclical trends and patterns that exist in an otherwise complex wave function.
In fact, all waves can be broken down into a sum of smaller sine waves. This is also known as Fourier’s Theorem and has huge implications in terms of signal processing, mathematics, etc.
Filtering out Frequencies
The way that this is applied to the radio is when you tune to a station. Each station has the main wavelength that it is being broadcasted on (90.1 MHz or 90.1 million oscillations per second). And on top of that wave, the actual sound is being encoded.
So your radio uses what is called a bandpass filter to filter out that main wavelength. What remains is the signal that carries your music, or static in the case of there being nothing broadcasted on said frequency.

Applying to the Markets
And so, we can use this same underpinning technology to ‘tune’ to certain frequencies to identify trends in the market.
However, consider this:
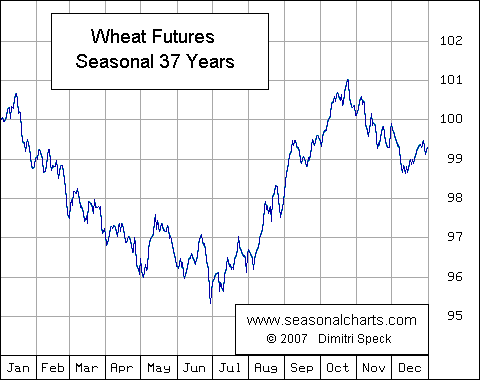
There is clearly a seasonal trend in Wheat futures that fluctuates about once every 6 months. Identifying this trend, when it is happening, and the amount of ‘energy’ in said trend would yield us a very profitable system, especially if automated and applied to hundreds of assets at the same time, which is exactly what I did.
Crafting the Strategy
A bandpass filter is good at isolating specific frequencies, but also is used to isolate a range of frequencies. So I defined a range of cycles that I want to look out for in each asset I am trading.
I picked a low end of 0.01 hertz, or one cycle every 100 days, and a high end of 0.1 hertz, or one cycle of every 10 days. This gives the strategy the breadth to be able to identify trends from any range that is interesting to us while cutting out the noise of daily ‘trends’ that result in noise pollution or over trading.
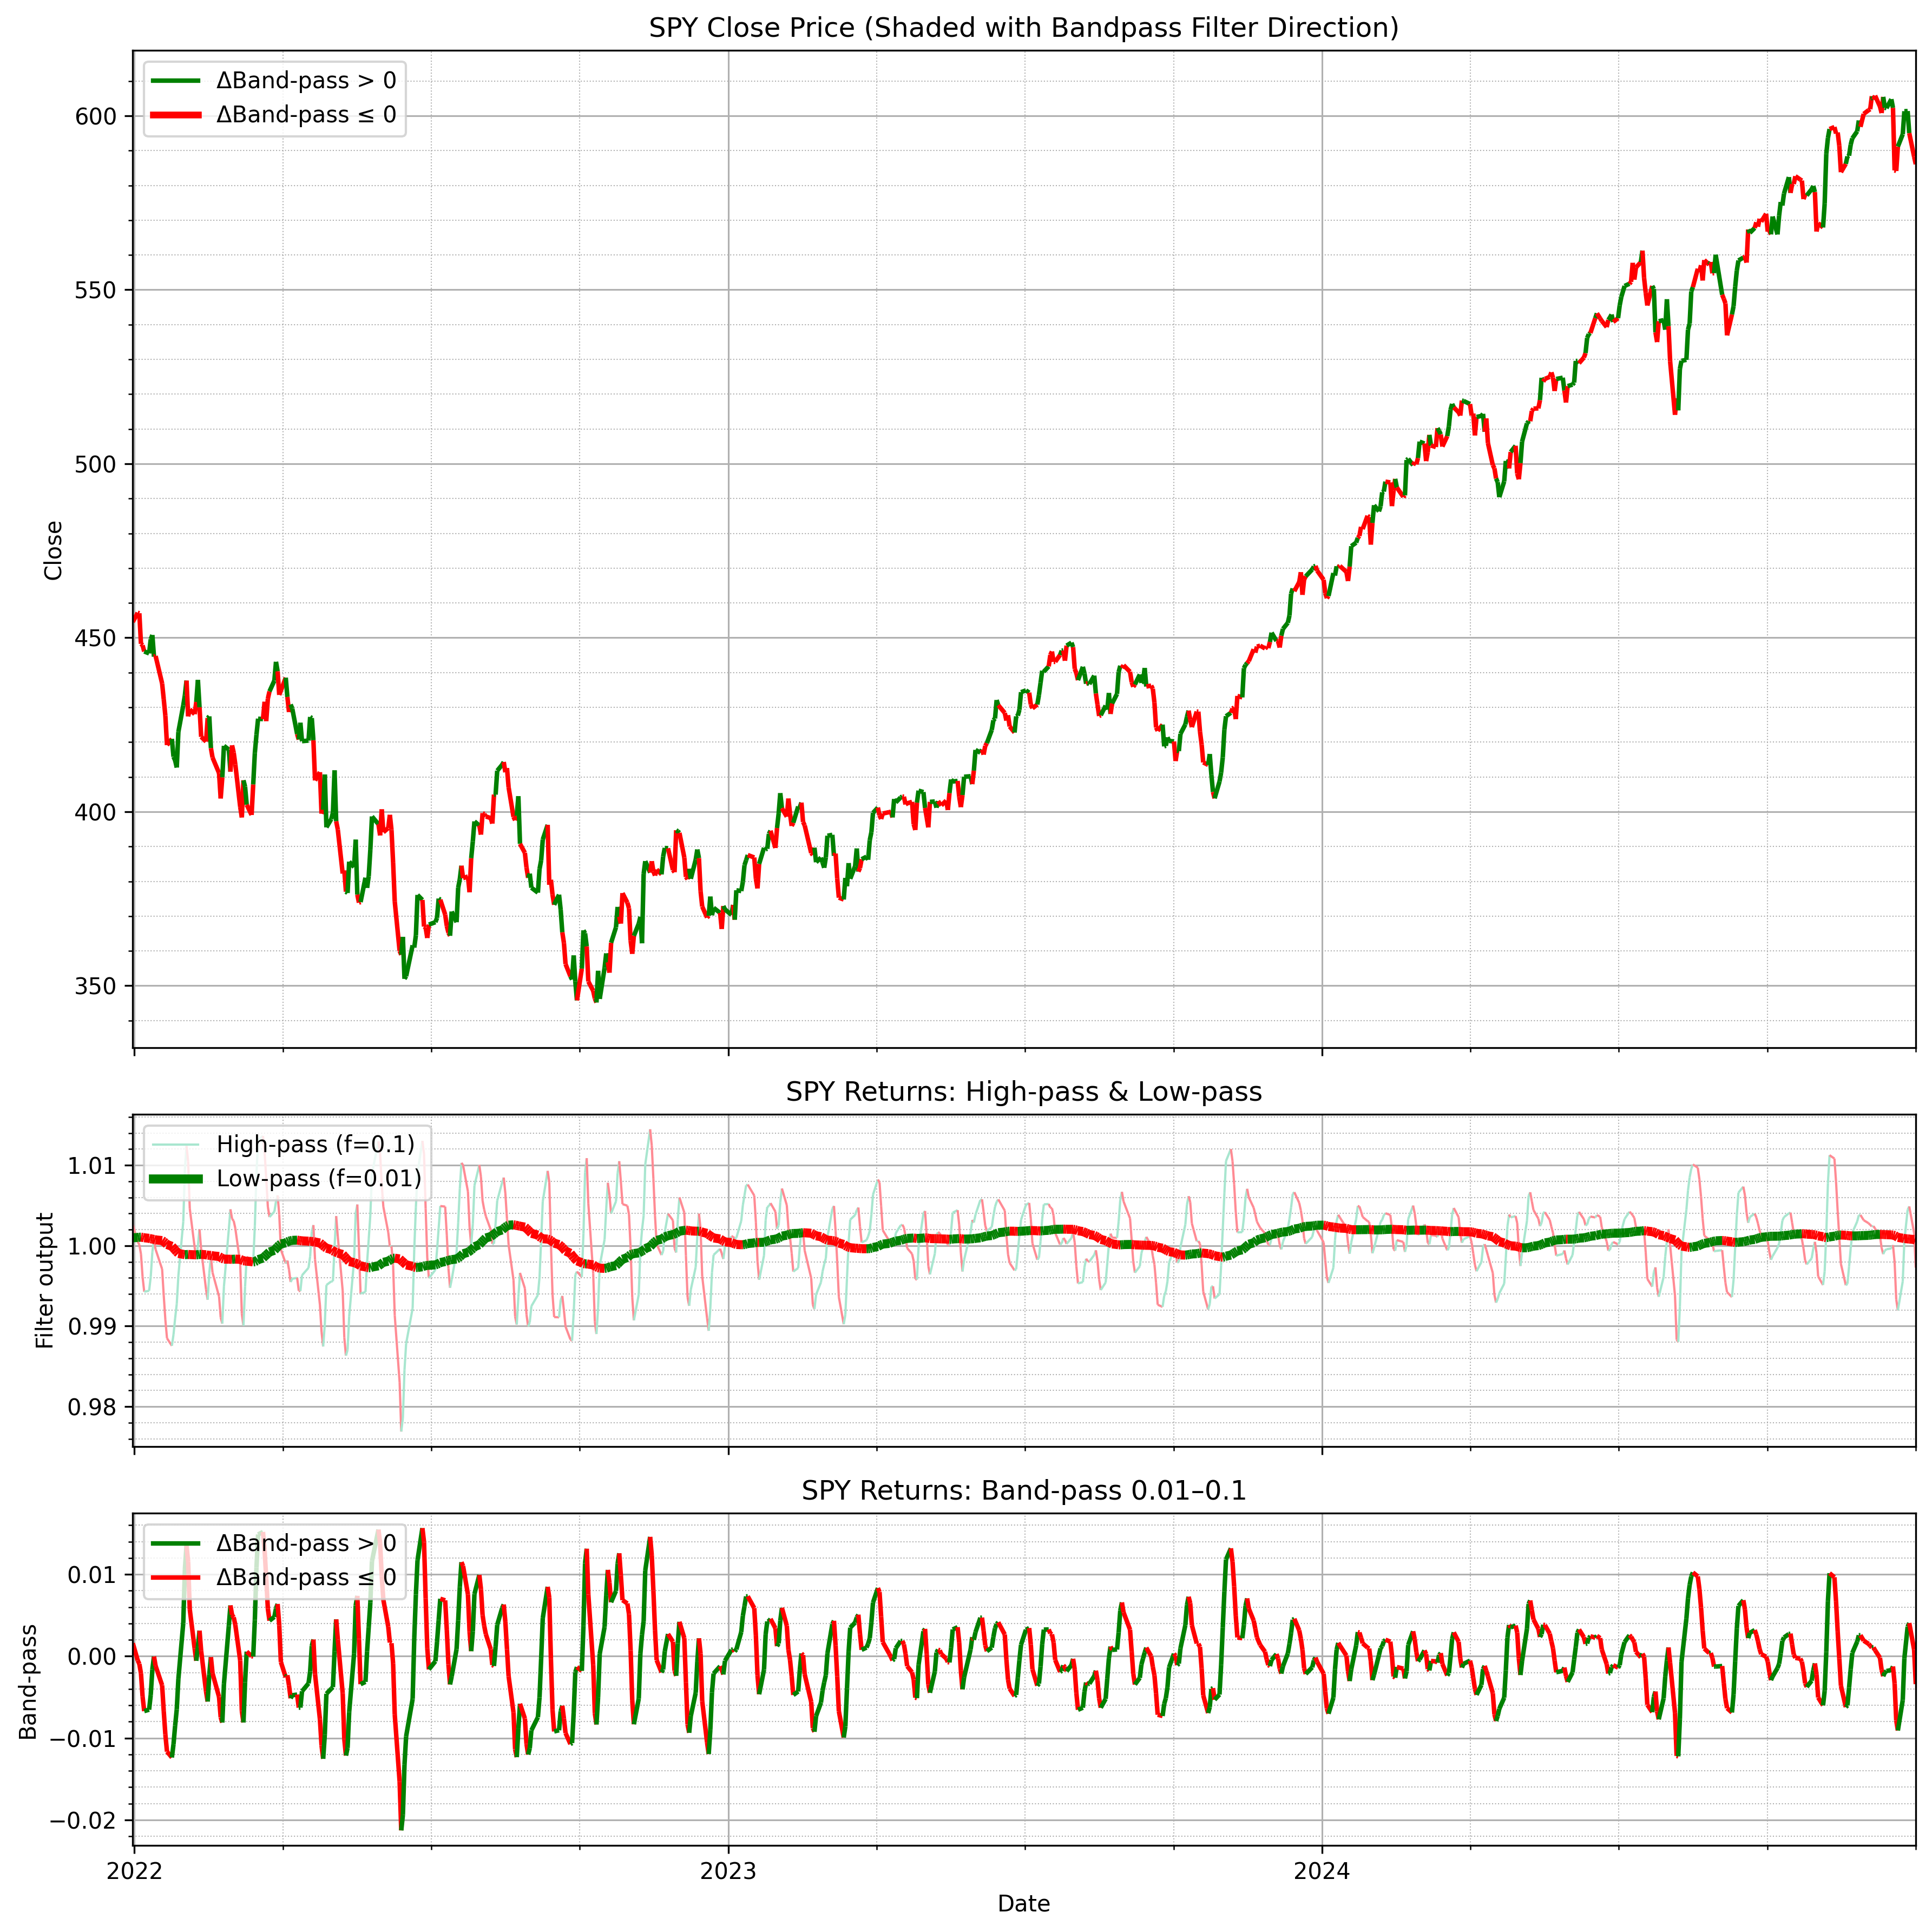
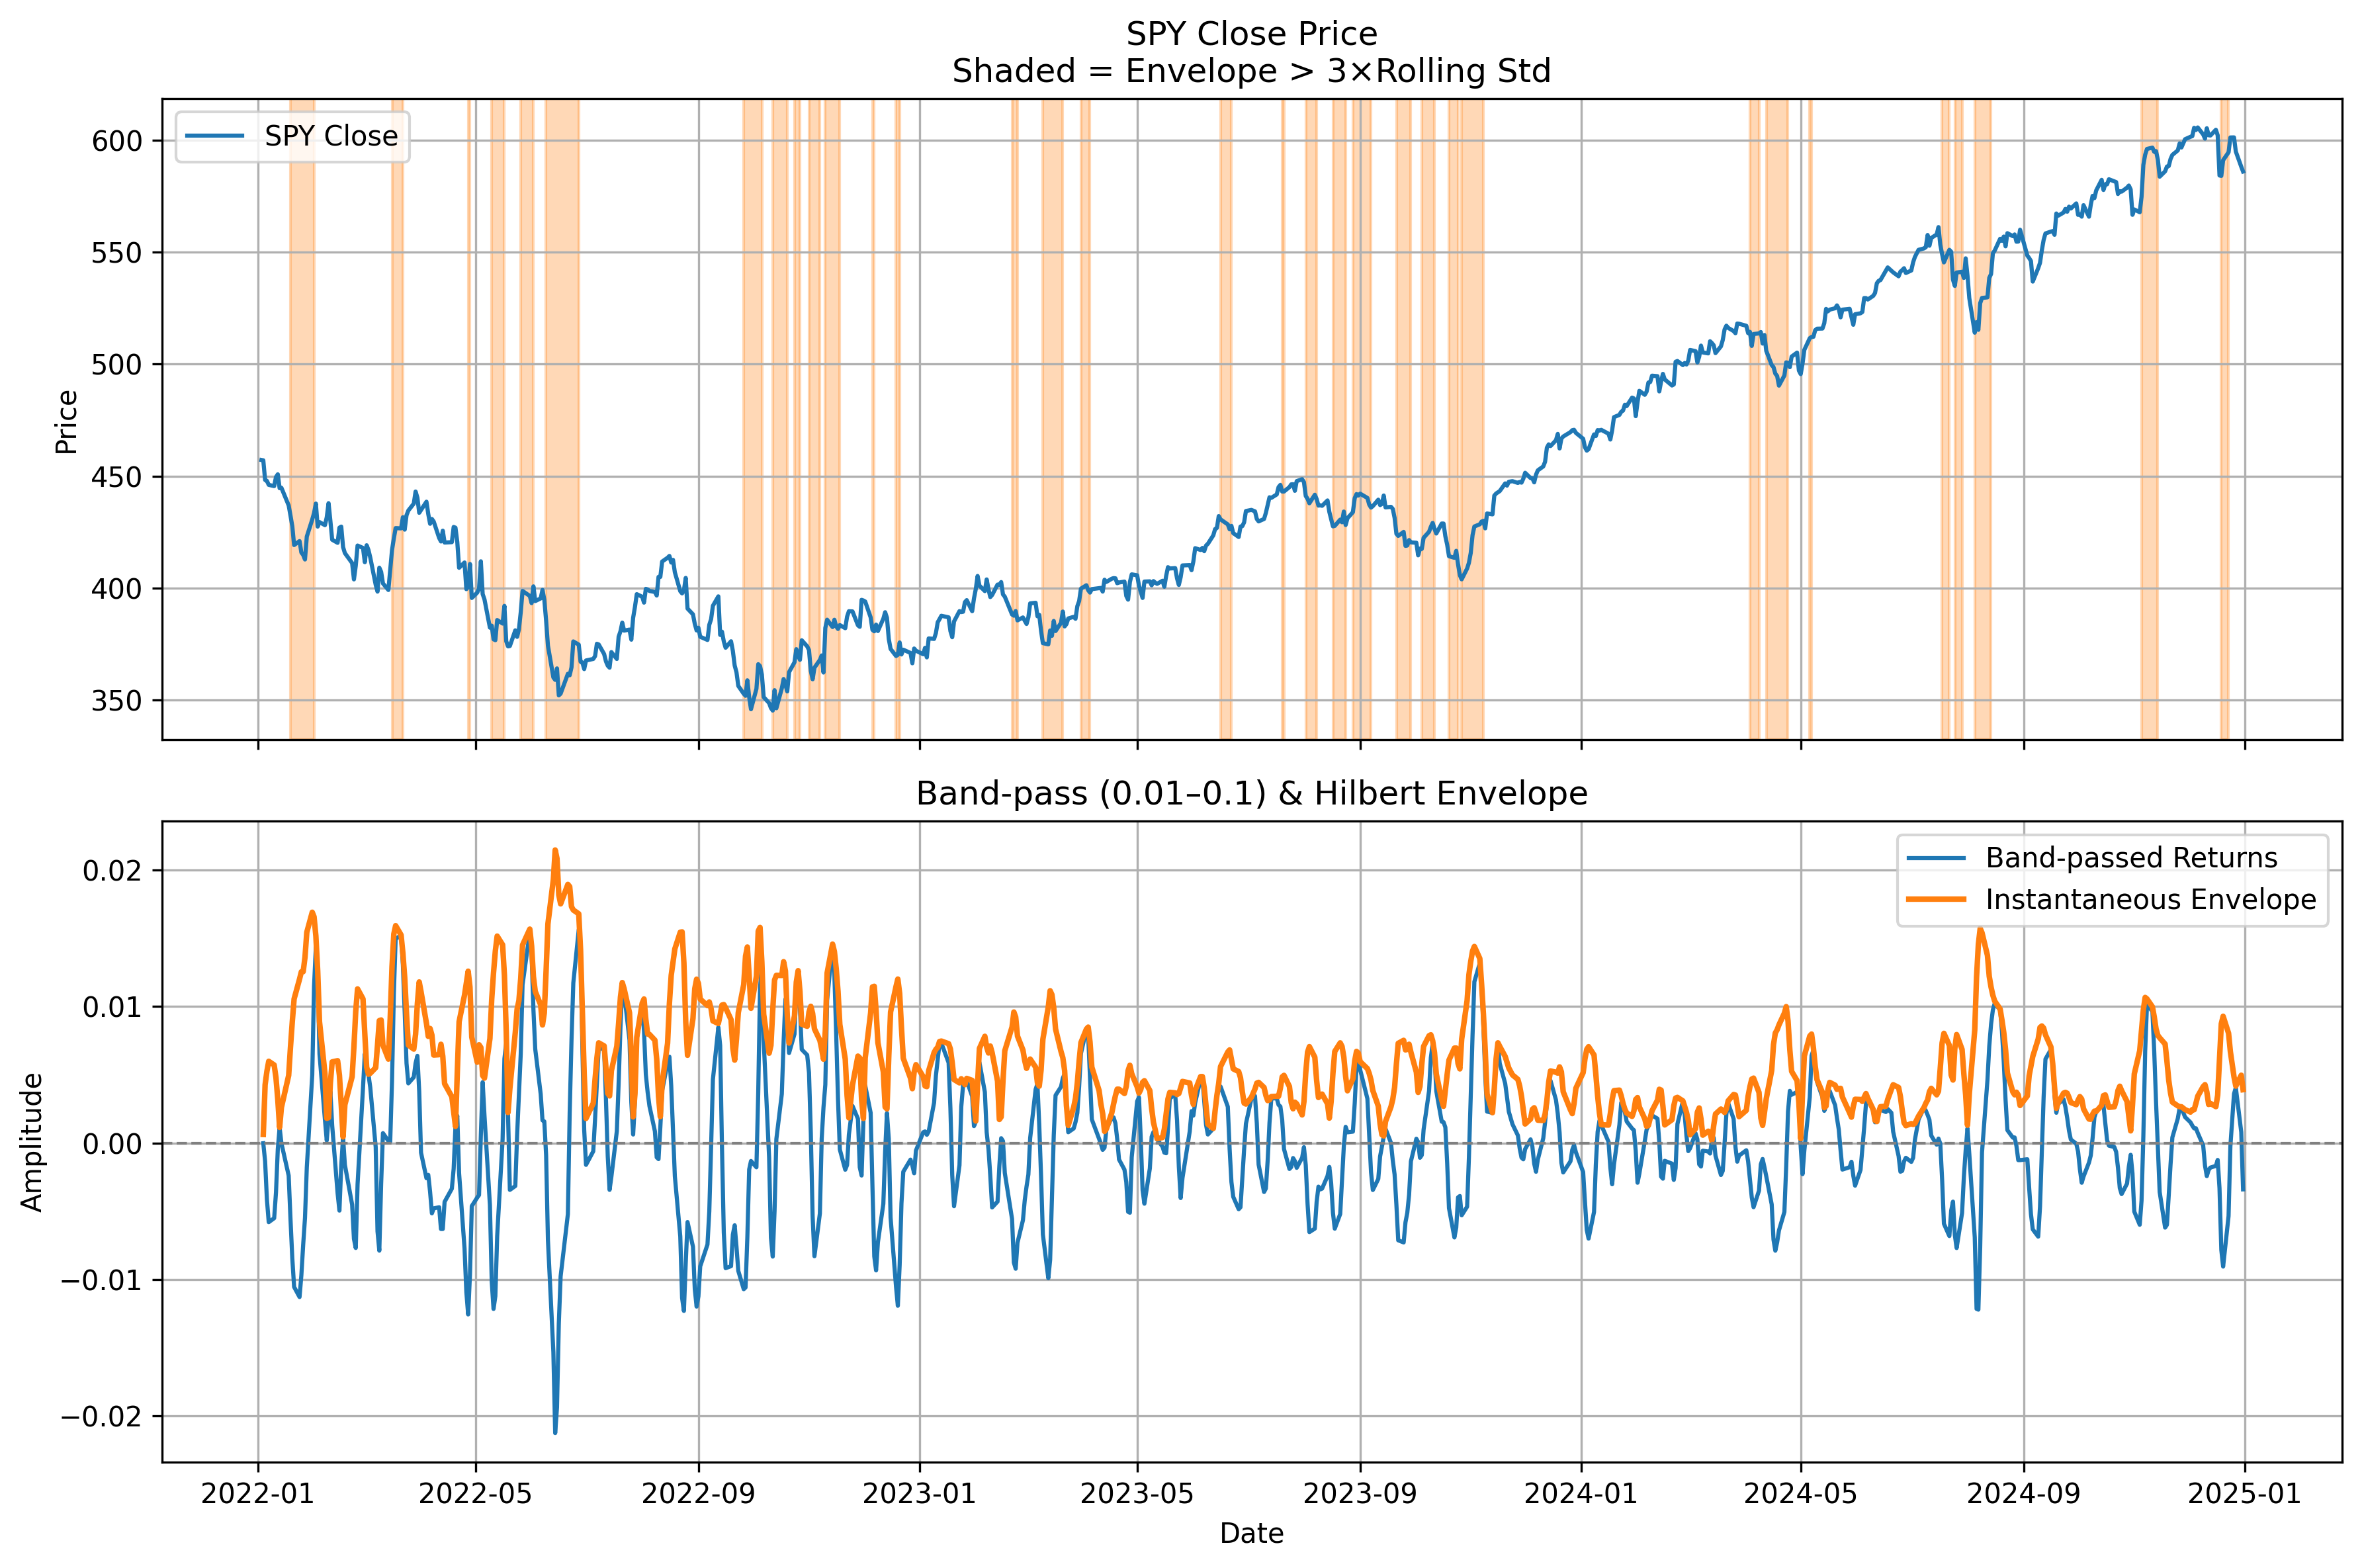
Above is the result of the bandpass filter on the SPY. I shaded the price line green when the bandpass was increasing and red when it was decreasing. You can see how it is able to roughly identify trends.
Thinking in Energy
However, it’s not accurate enough to become a strategy. So on top of the bandpass filter, I added a Hilbert Transform which quantifies the amount of energy in a signal. This energy can be used, especially in a comparative situation, to find out which signals are the strongest, regardless of the direction they are heading.
The Hilbert Transform uses the bandpass filter components to determine where in the cycle we are and thus how energetic this cycle is.
Think of boat on the water. It bobs up and down with the waves with the waves being cyclical. Every minute the boat hits the peak or the trough in the wave. Because we know the wave is behaving regularly, we can measure the velocity of the boat being lifted on the wave to determine well before we hit the peak of the wave how strong the wave is.
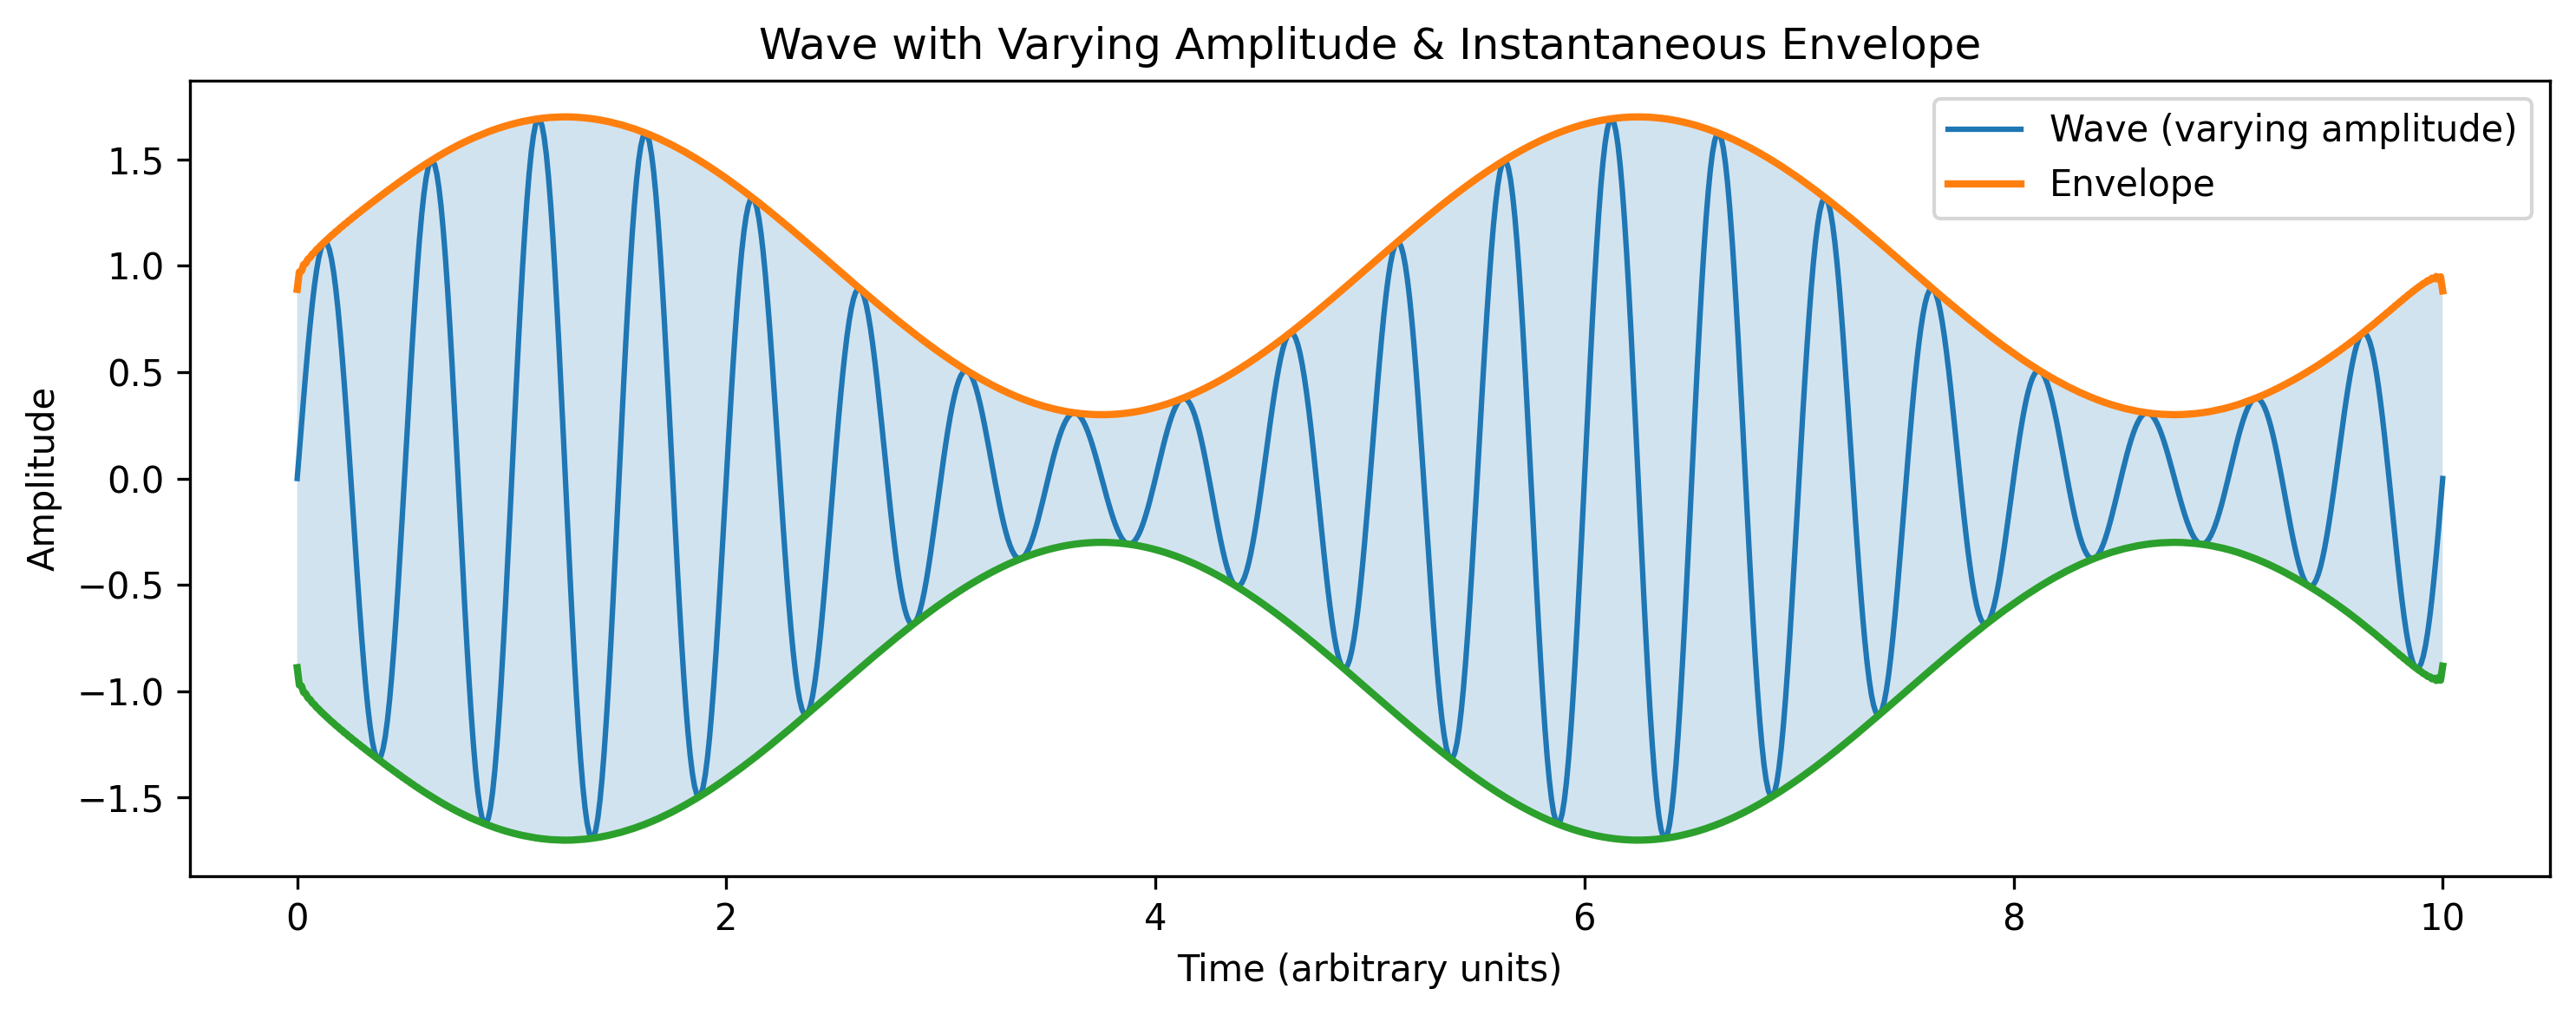
The Hilbert Transform quantifies this as ‘energy’ or strength of the wave. See above. Using the varying amplitude, an instantaneous envelope is created that can tell us how strong the signal is along its regular path.
I applied the Hilbert Transform to the SPY with the bandpass filter and highlighted where the envelope is greater than 3x the rolling standard deviation across 60 days. Now, you can see clearly how high volatility moments in the SPY are identified.
Scaling Across Assets
With this concept in mind, I built a trading strategy that looks at all 500 components of the SP500. The rules are as follows:
Ingest prices and keep track of history.
Every period, I track all of the assets I am trading and keep a history of their returns.
Calculate the Bandpass Filter
Then, I calculate a Bandpass Filter for frequencies 0.01 and 0.1 for every asset to determine their core trend components.
Compute Instantaneous Energy via Hilbert Transform
Next, I compute how much energy is in each asset with the Hilbert Transform as laid out above.
Measure Energy Momentum
Rather than just selecting assets with high energy, I look at assets with the highest change in energy. This identifies the assets that are poised to pop.
Rank and Normalize into Weights
I take the top 5 performers and assign weights to them exponentially based on their rank, giving the strategy a bit of diversification without missing out on the true winners.
Invest
With the calculated weights, I now adjust my portfolio. I run this once a week on Mondays to keep transaction fees low.
The Results
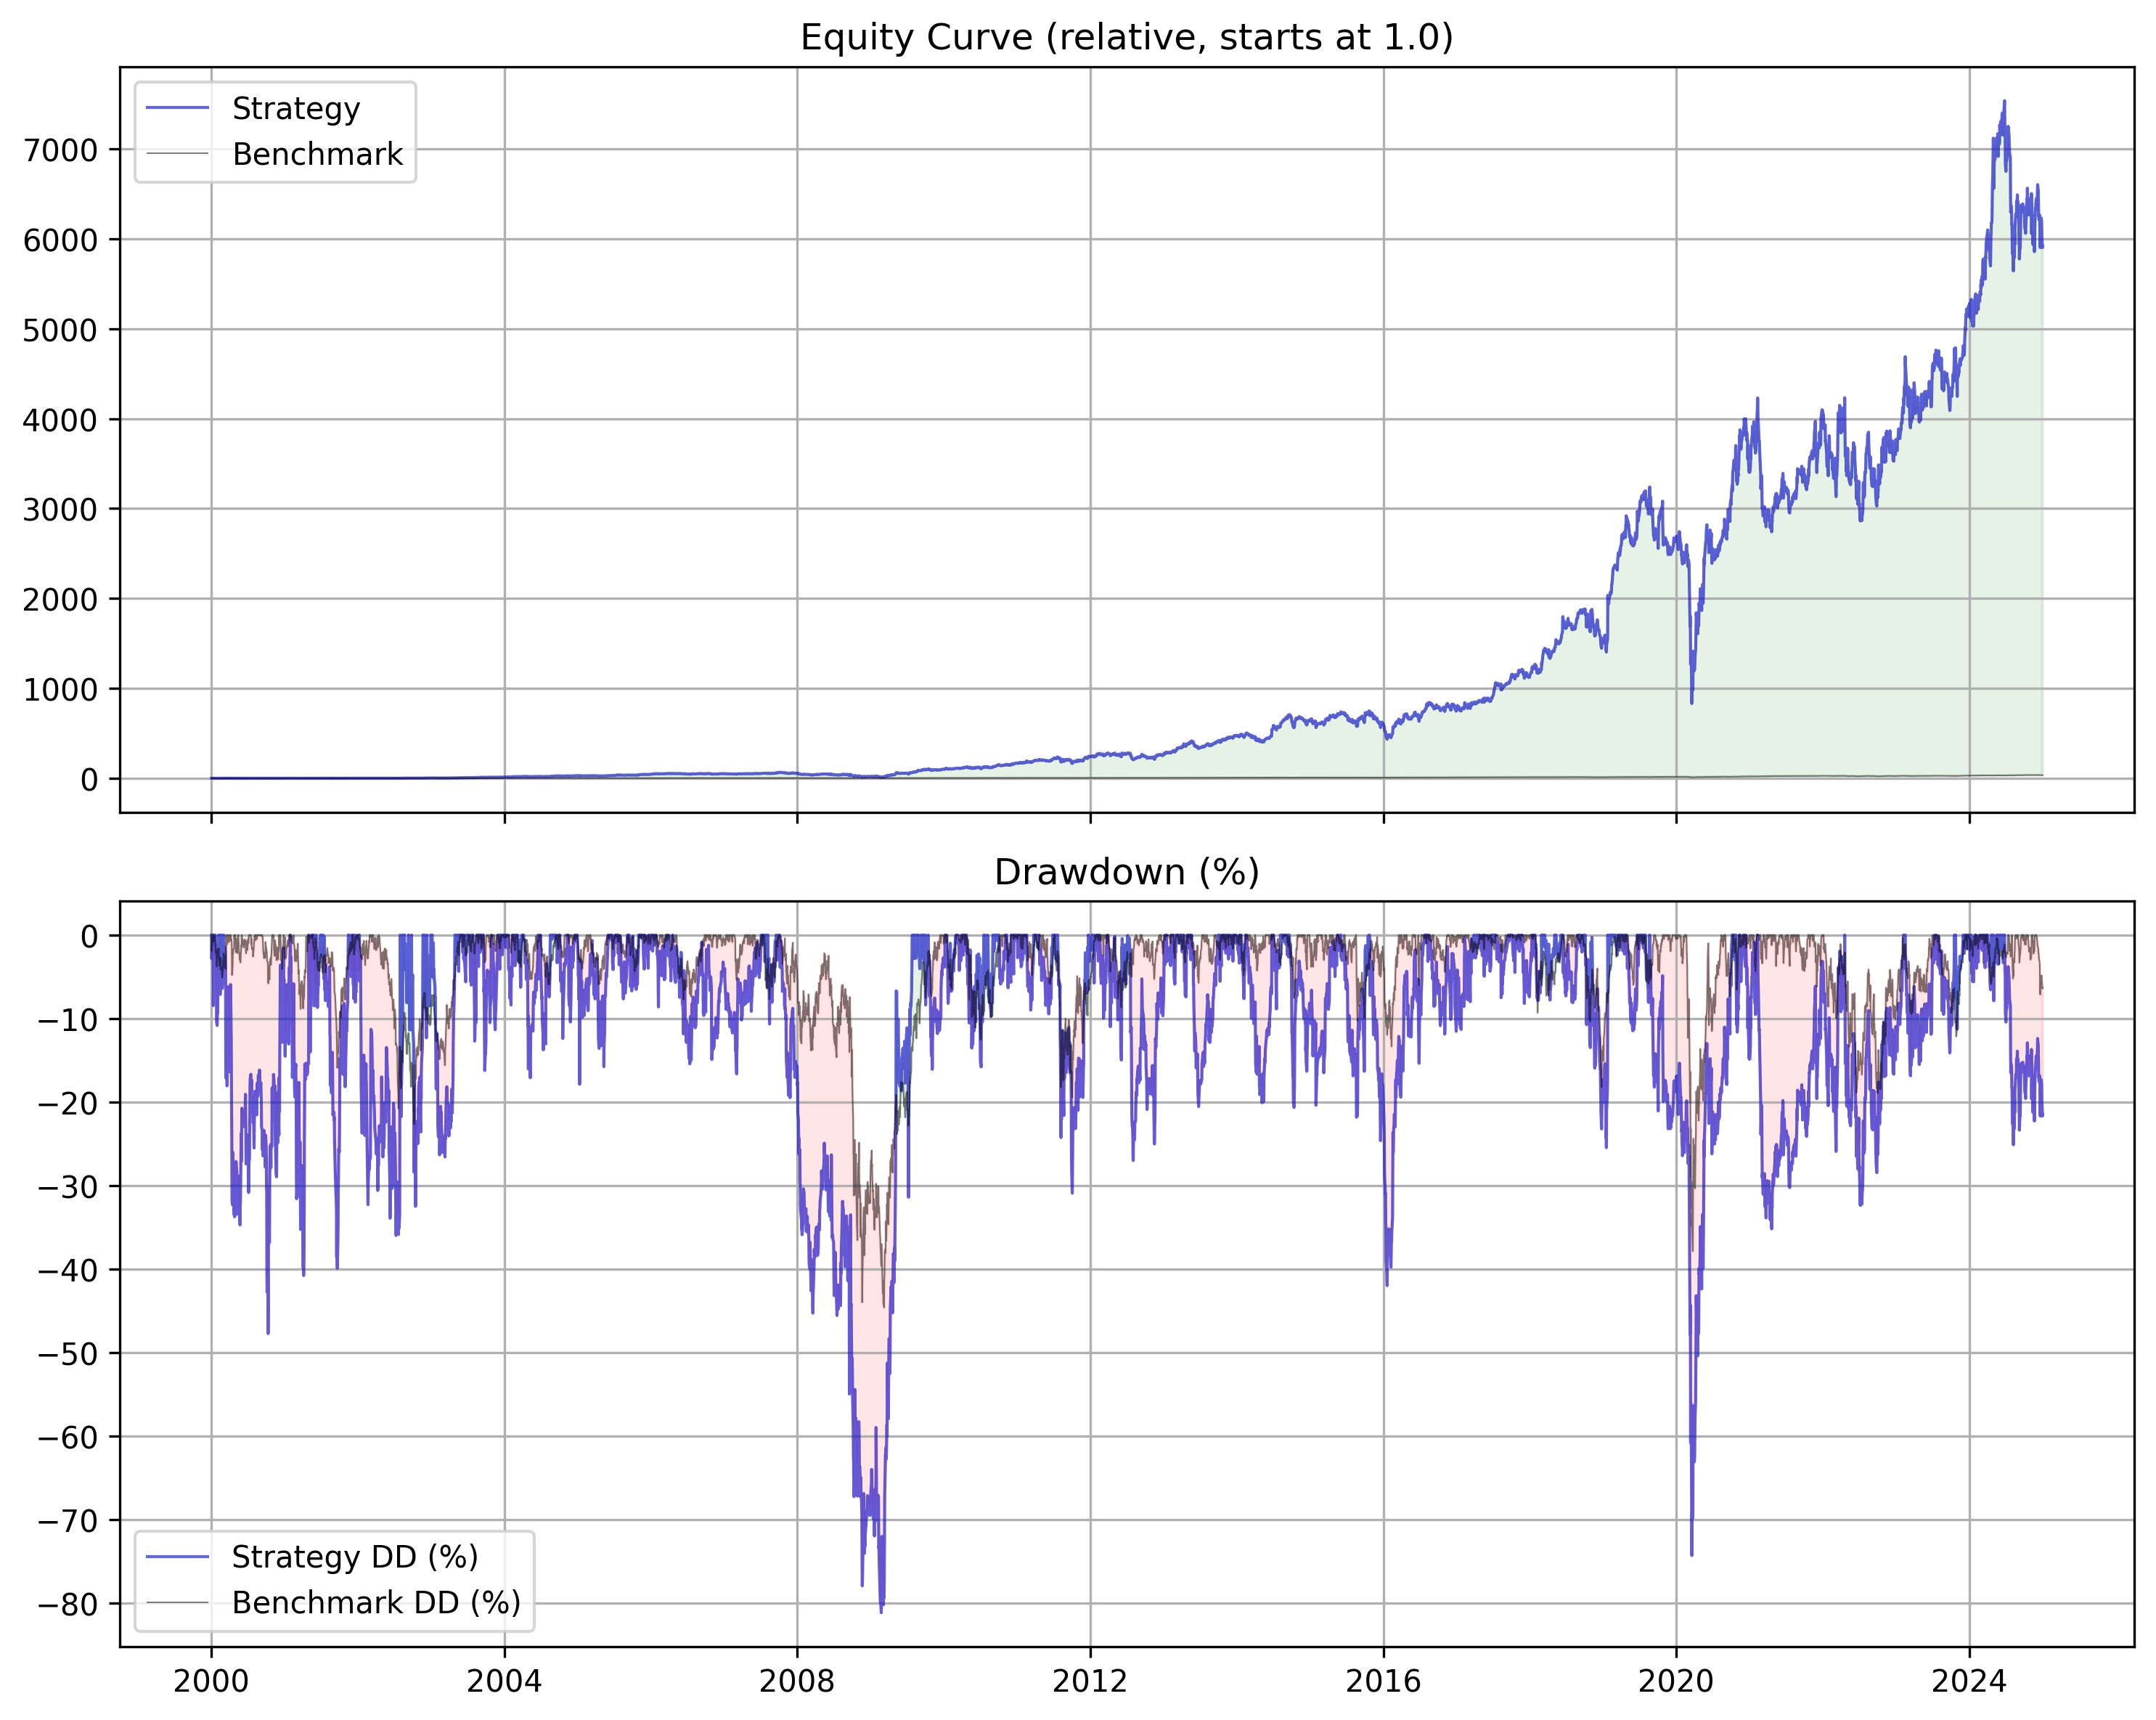
The results of this strategy are shocking. $1 in 2000 turns into $6000 in 2024 (without fees.) The risk taken, however, is greater than an equally weighted portfolio of SP500 components. And so, this strategy is not without some downside.
Similarly, this strategy is more sensitive to transaction fees than other weekly rebalancing strategies.
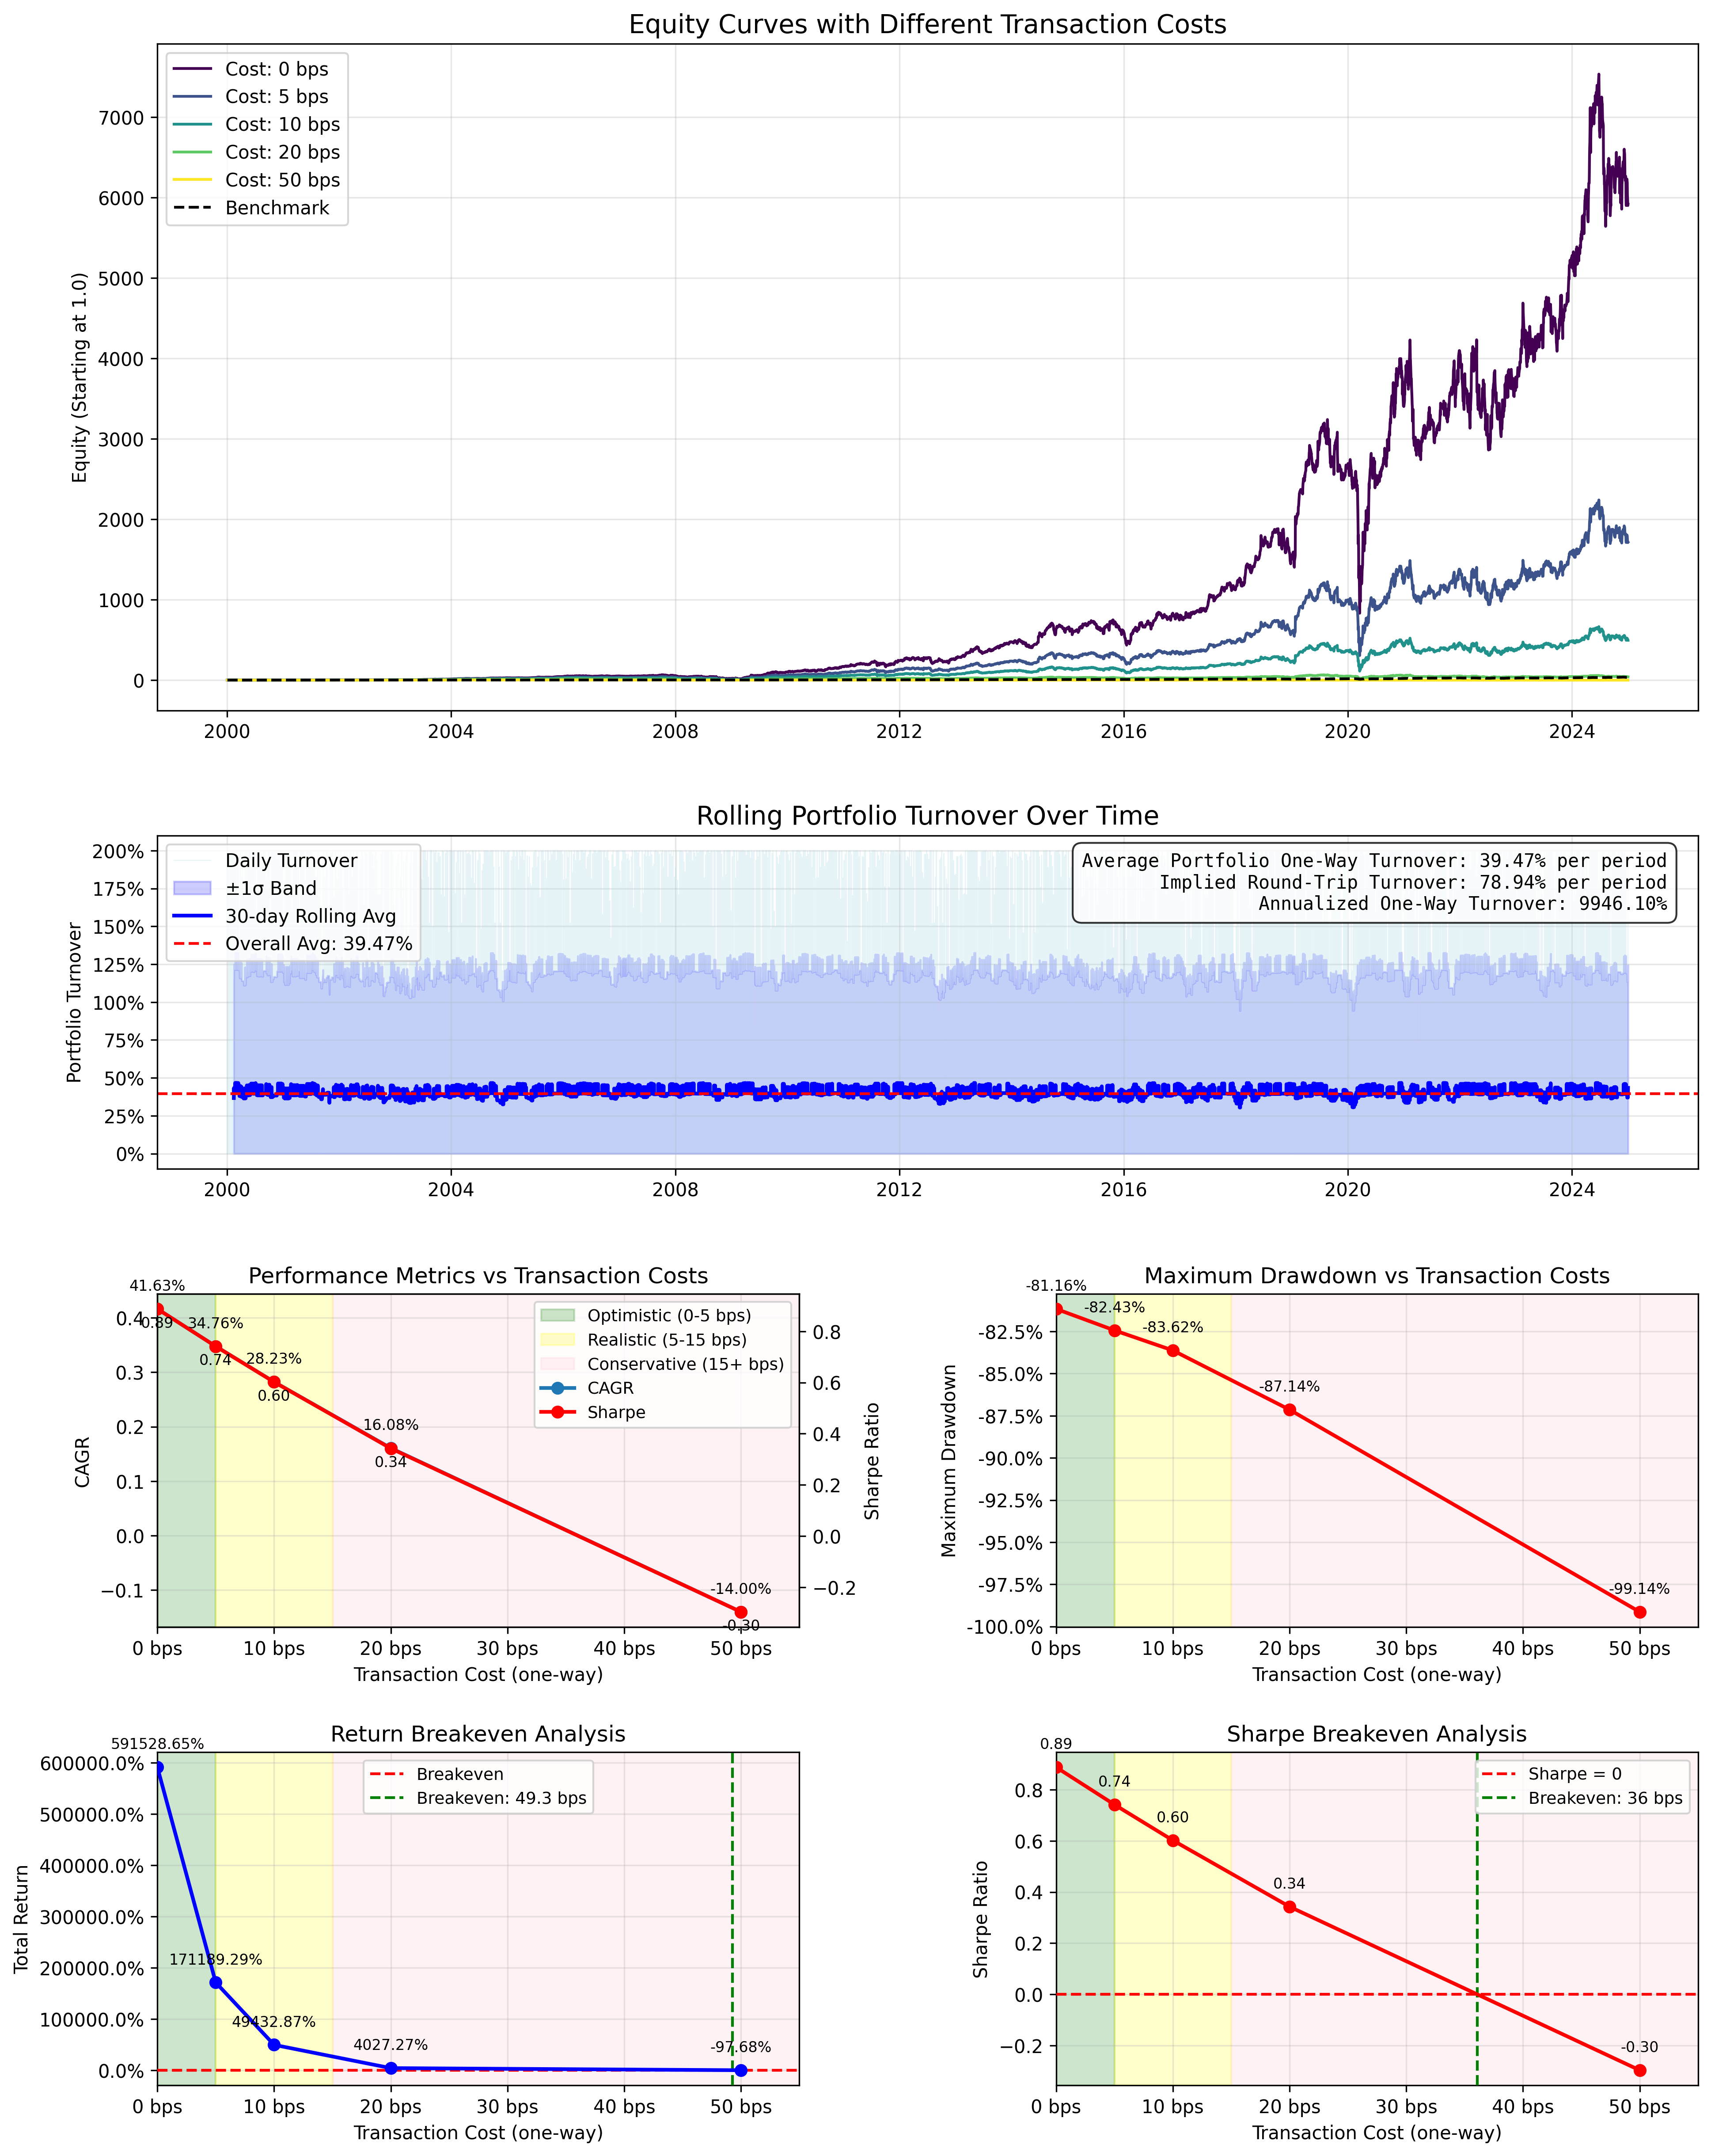
A CAGR of over 41% drops to around 30% with only 10 basis points of fees, which is standard.
More research needs to be done in terms of figuring out how to reduce turnover. There is also much more to be done in terms of the underlying system- experimenting with bandpass frequency ranges, using explicit high and low pass filters, etc.
Downloading the Code
The code of this strategy and the accompanying visualizations is all available here:
Don’t forget to subscribe!
And as always, thank you for your support. Happy researching!
Have you tried using traditional stop losses?
It certainly reduces profitability, but with this strategy, that shouldn't be a problem.