


I Tested 87 Different Stop Loss Strategies - And Found the 10 You Should Always Use
I discovered 10 new classes of stop loss strategies that all beat the state-of-the-art.


Stop losses are a way of life for a trader. They are often ‘do or die’ in situations of intraday and leverage trading. However, we think that the ‘gold standard’ is the average trailing stop. Maybe we add an ATR band to it if we are feeling fancy.
But the reality is that there are much more effective stop loss strategies that exist. And, these strategies are not part of the mainstream.
Here’s the thing:
I found a new class of strategies that are completely different than our current understanding and not only defend capital, but let winners ride better than the state of the art.
How much are you letting lose by using the current state-of-the-art? The answer is too much.
What’s in a Stop Loss
A stop loss is an order that we take out to close our current position when the price moves too much against us.
We can use them to minimize downside risk: “I only want to be down a maximum of 5% on this trade.”
Or to create risk-reward systems: “I will stop out trades that move 1% against me, and take profits from trades that move 2% with me.”

The challenge is selecting a stop loss that cuts your losses, but also lets winners ride.
Far too often does a stop loss actually turns a trade that would have been a winner into a loser. Like the example below:
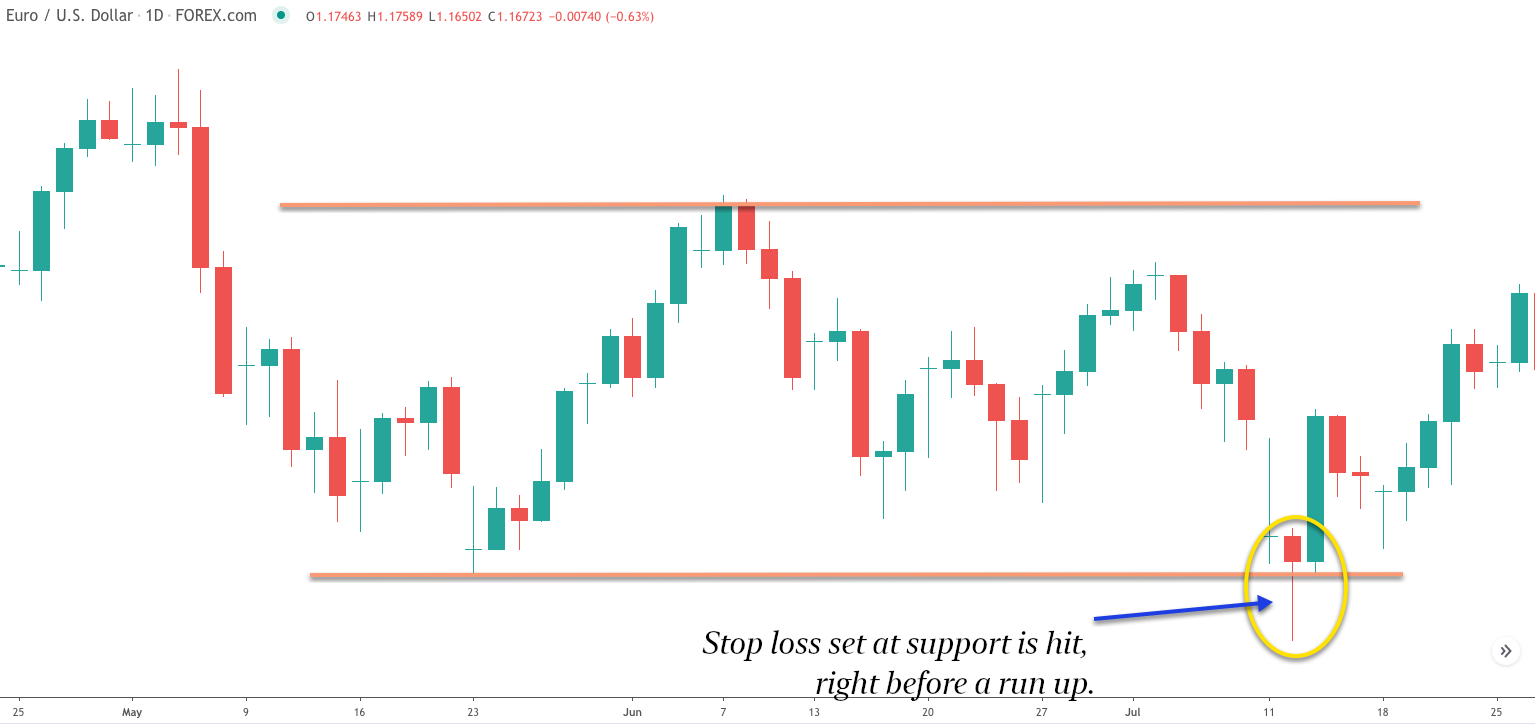
So how do we balance between downside risk mitigation and upside potential? Well, there are some more dynamic trailing stop loss systems like ATR and Parabolic SAR that take into account volatility, trends, and momentum. They seem to help.

But the reality is that is all depends. There isn’t really a good metric to determine how well a stop loss is at risk mitigation and upside potential… until now.
Determining How Good A Stop Loss Is
Good is a loaded term.
We want to find the best stop loss. But what does that mean exactly? The ‘best’ in every single situation? How do you even measure the best?
To solve this, I came up with a simple system. I simulate taking out a trade every single day, a long and a short, and I ride that trade until it is stopped out.
This generalizes the stop loss over every potential trading strategy.
“It’s better for us to know generally what stop losses work best in all cases than to find out which stop losses work even better in some.”
I then look at the next several time horizons forward: 1 day, 7 days, 14 days, 30 days, 90 days, etc. to see how much downside I avoided. I also record how much upside I achieved on each trade.
Thus, I can quickly see if a stop loss is ‘good’ or not based on two basic metrics: average amount of downside it avoided versus the baseline, and how much average upside it achieved by letting winners run.
What this Looks Like in Practice
I wrote an ATR Volatility Stop Loss and set the window to 14 days and the multiplier to 2x.
This is a non-trailing stop that sets a fixed stop lot price determined by the ATR calculation on entry.
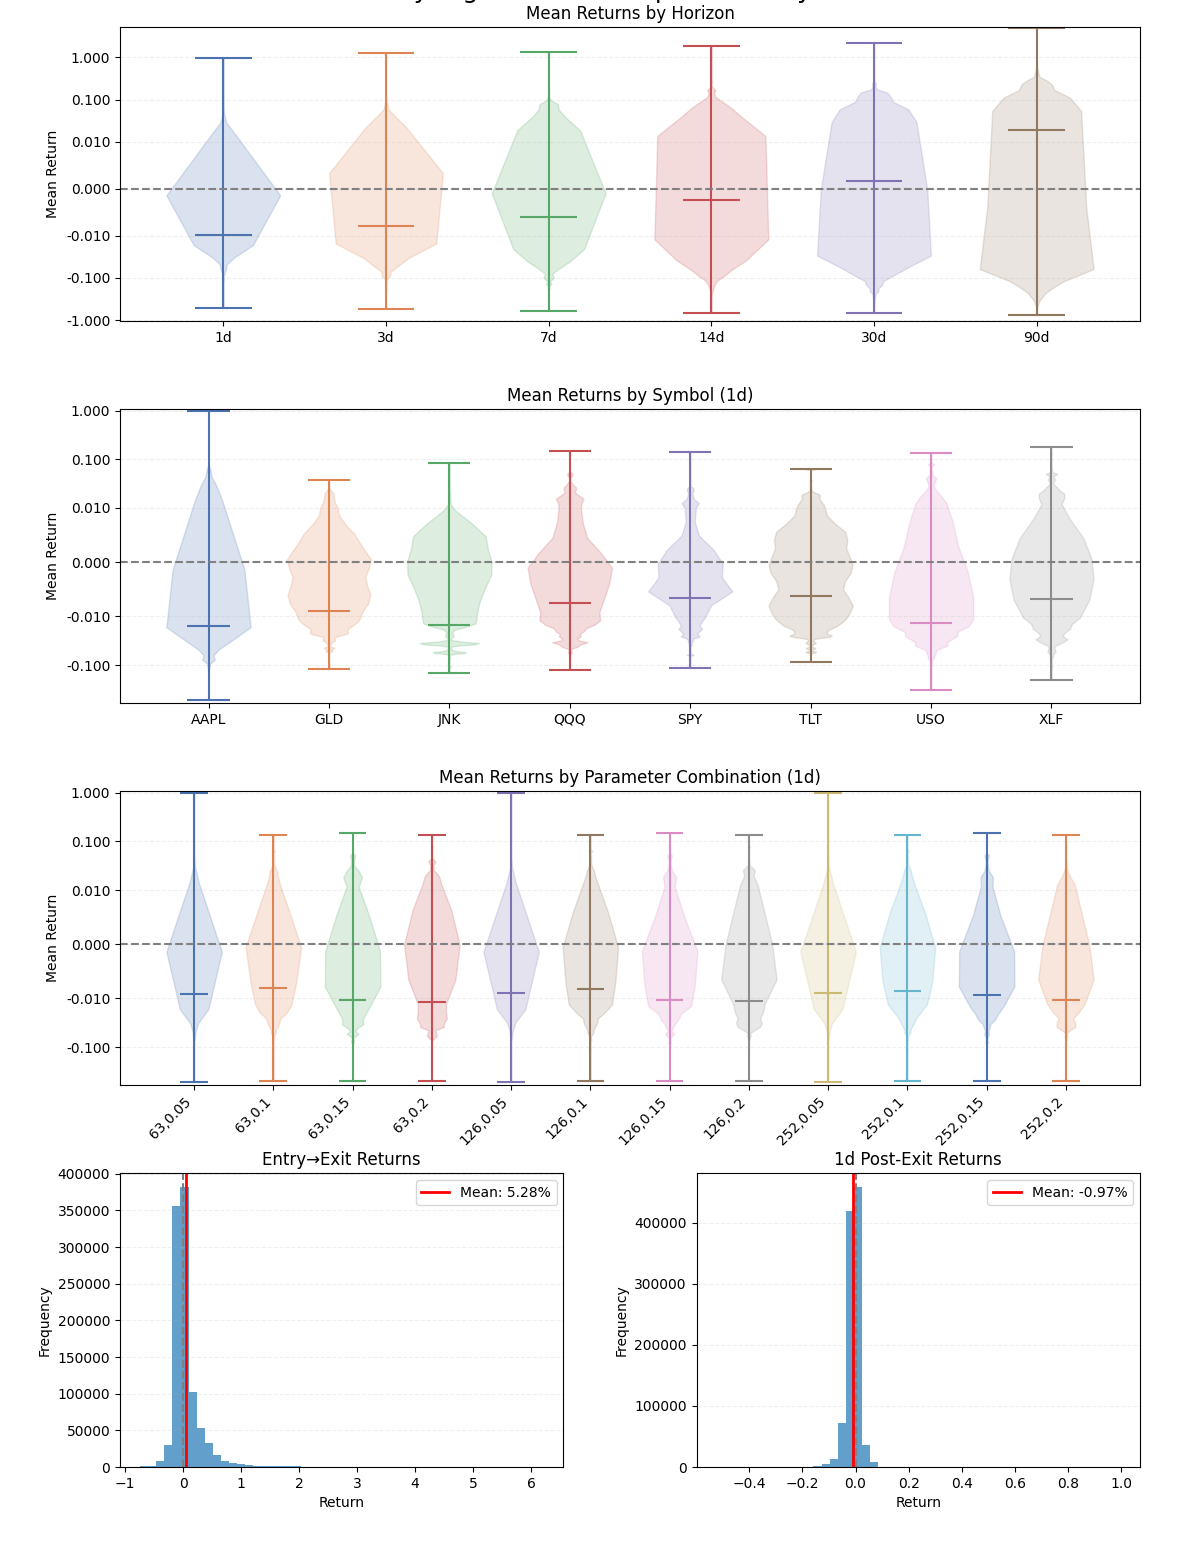
When I run this on NFLX, I get the following output.

The violin plot shows the distribution of returns after our exit. The x-axis is how many days forward. You can see that most time horizons have a mean return that is negative, meaning that our stop loss consistently prevented further downside risk.
The entry → exit plot tells a different story. All returns are negative, of course. This is because this is a non-trailing stop or a stop that never sets its stop level above the entry price. There are some stop losses where this will be positive.
The 1-Day Post-Exit Returns plot shows more closely the distribution of the first violin. We get an exact metric as to how well this system prevented further ruin, which we can consider it’s defensiveness.

With this system in place, we can expand this to:
More systems
More parameters
More stocks
And get an even better picture at generalizing how good a stop loss is.
The Initial Candidates
There’s a ton of literature on the ‘standard out-of-the-box’ stop losses. If you are familiar with MetaTrader and Forex trading, you probably have installed a thousand different EAs with wild and zany stops that ultimately did nothing to help your slow (or fast) grind to an account with $0 in it.
So I wanted to start with these as a base, but also generate a list of novel and new stops that could lead us towards a new direction or discovery in the stop loss space.
I started with the following:
Fixed loss ← our baseline or ‘control.’ It always loses money, because it’s only hit when the trade is underwater. But, it could save us from future losses.
Never readjusts
Parameter sweep: 0.25%, 0.5%, 1%, 2%, 5%, 10%, 20%
Trailing Percentage Stop:
Readjusts stop X% below the last close.
Parameter sweep: 0.25%, 0.5%, 1%, 2%, 5%, 10%, 20%
ATR Trailing Stop
Readjusts stop based on ATR volatility across a window
Parameter sweep:
Window: 7, 14, 28, 60, 90, 180
Multiplier: 1, 1.5, 2, 3, 5
Parabolic SAR Trailing Stop
Readjusts stop based on acceleration
Parameter sweep:
Acceleration: 0.01, 0.02, 0.03, 0.04, 0.05, 0.07, 0.1
Max Acceleration: 0.1, 0.15, 0.2, 0.25, 0.3, 0.4, 0.5
I ran every single parameter combination on 8 stocks, SPY, GLD, JNK, AAPL, QQQ, TLT, USO, and XLF, to get a wide array of situations that I could then use to generalize how good a stop loss strategy really is.
The Findings
Let’s dive into what I found:
Fixed Stop Loss:

Unsurprisingly, the Fixed Loss cuts our losses, but really does nothing in relation to saving us from further declines. There is a slight pattern that shows that tighter stops prevent us from losing a whopping 6 basis points more, but that really is not enough to build a system around.
Trailing Percentage Stop Loss:

This stop loss is a bit better. The average returns that one gets when using this stop loss is actually positive, which makes sense because the stop price adjusts as the trade moves in our favor. However, a tighter stop is better (0.25%, which is not a lot at all). And, it doesn’t really seem to help us prevent future downside, as the next days returns are only 15 basis points against us on average.
Trailing ATR Stop Loss:

In an unexpected turn of events, adding an ATR actually hurts our general performance, especially when using a multiplier of 1. It seems that multipliers of 1 are making our graph seem worse than it might be, as they are clear outliers.
But, regardless, what this shows is that ironically, setting the multiplier to 1 stops us out the day before on average we would make 0.6% or 60 basis points. That’s a lot!
Other configurations seem to do better, with their averages being slightly negative.
Trailing Parabolic SAR Stop Loss:

While hard to read, this one is so far our ‘state-of-the-art.’ Most time horizons forward, every stock, and every parameter selection all closes negative on average. This means that in most cases, the Parabolic SAR will protect us from further losses. In fact, you can expect 30 basis points of immediate next day savings.
Going Nuclear - The Other 83 Stop Losses
But what fun is 4 when we can create and test so many more? I created 83 more systems that expanded across a super wide array of domains.

These systems are classified into the following types:
Trend indicators (ADX, ATR, Moving Averages, Supertrend)
Oscillators (RSI, MACD, Stochastic, Williams %R)
Volatility measures (Bollinger Bands, Keltner Channels, Standard Deviation)
Volume-based (OBV, Money Flow Index, Volume Spike)
Pattern recognition (Doji, Bearish Engulfing, Three Bar Reversal)
Support/Resistance (Pivot Points, Fibonacci, Support/Resistance levels)
Time-based (Day of Week, Seasonal, Time-based)
Advanced (Point & Figure, Renko, Triple Barrier)
And from these systems, emerged a few winners. Every one of these is a completely new class that outperforms Parabolic SAR. Let’s get into it.
#1 Pivot Point Stop Loss

The Pivot Point Stop Loss uses the classic pivot point formula to determine where the stop out show be placed. This, however, cannot guarantee to be trailing. So, it beats Parabolic SAR by 176% in terms of risk mitigation. But, it does not trail as well.
On average, 83 basis points are avoided per trade when using this stop loss.
#2 Moving Average Crossover Stop Loss

As you can imagine, this stop loss is activated when the price crosses over or under a given moving average based on which direction the trade is headed (crosses under for longs, and over for shorts).
While it seems simple, it actually outperforms the more complex Parabolic SAR in both general profit capture and risk mitigation.
On average, 130 basis points are captured on the upside and 79 basis points are avoided on the downside.
#3 Keltner Channel Stop Loss

Similar to the prior stop loss and the Parabolic SAR, but it uses Keltner Channels instead as trailing bands. So far, this is our best trailing system, as it on average captures 211 basis points per trade, and mitigates 59 basis points on the downside.
#4 Maximum Drawdown Stop Loss

The Maximum Drawdown Stop Loss is closely related to a standard trailing stop loss. It looks at the peak achieved and
#5 Historical Quantile Stop Loss

The Historical Quantile Stop Loss looks at recent history and determines if the returns can be binned within one of the lowest quantiles. If so, the trade is exited. This system captures 375 basis points of upside on average and avoids 113 basis points of downside.
An incredible system that shows extreme versatility for every situation.
#6 - #10: It Gets Even Better…
As a special treat to my paid subscribers, I am giving 5 extra systems that perform even better. Just scroll to the bottom of the post to see the charts and pop open the Google Drive to get the code.
Want a sneak peak? Sure thing.
#6: 334 basis points upside gained, 223 basis points downside avoided

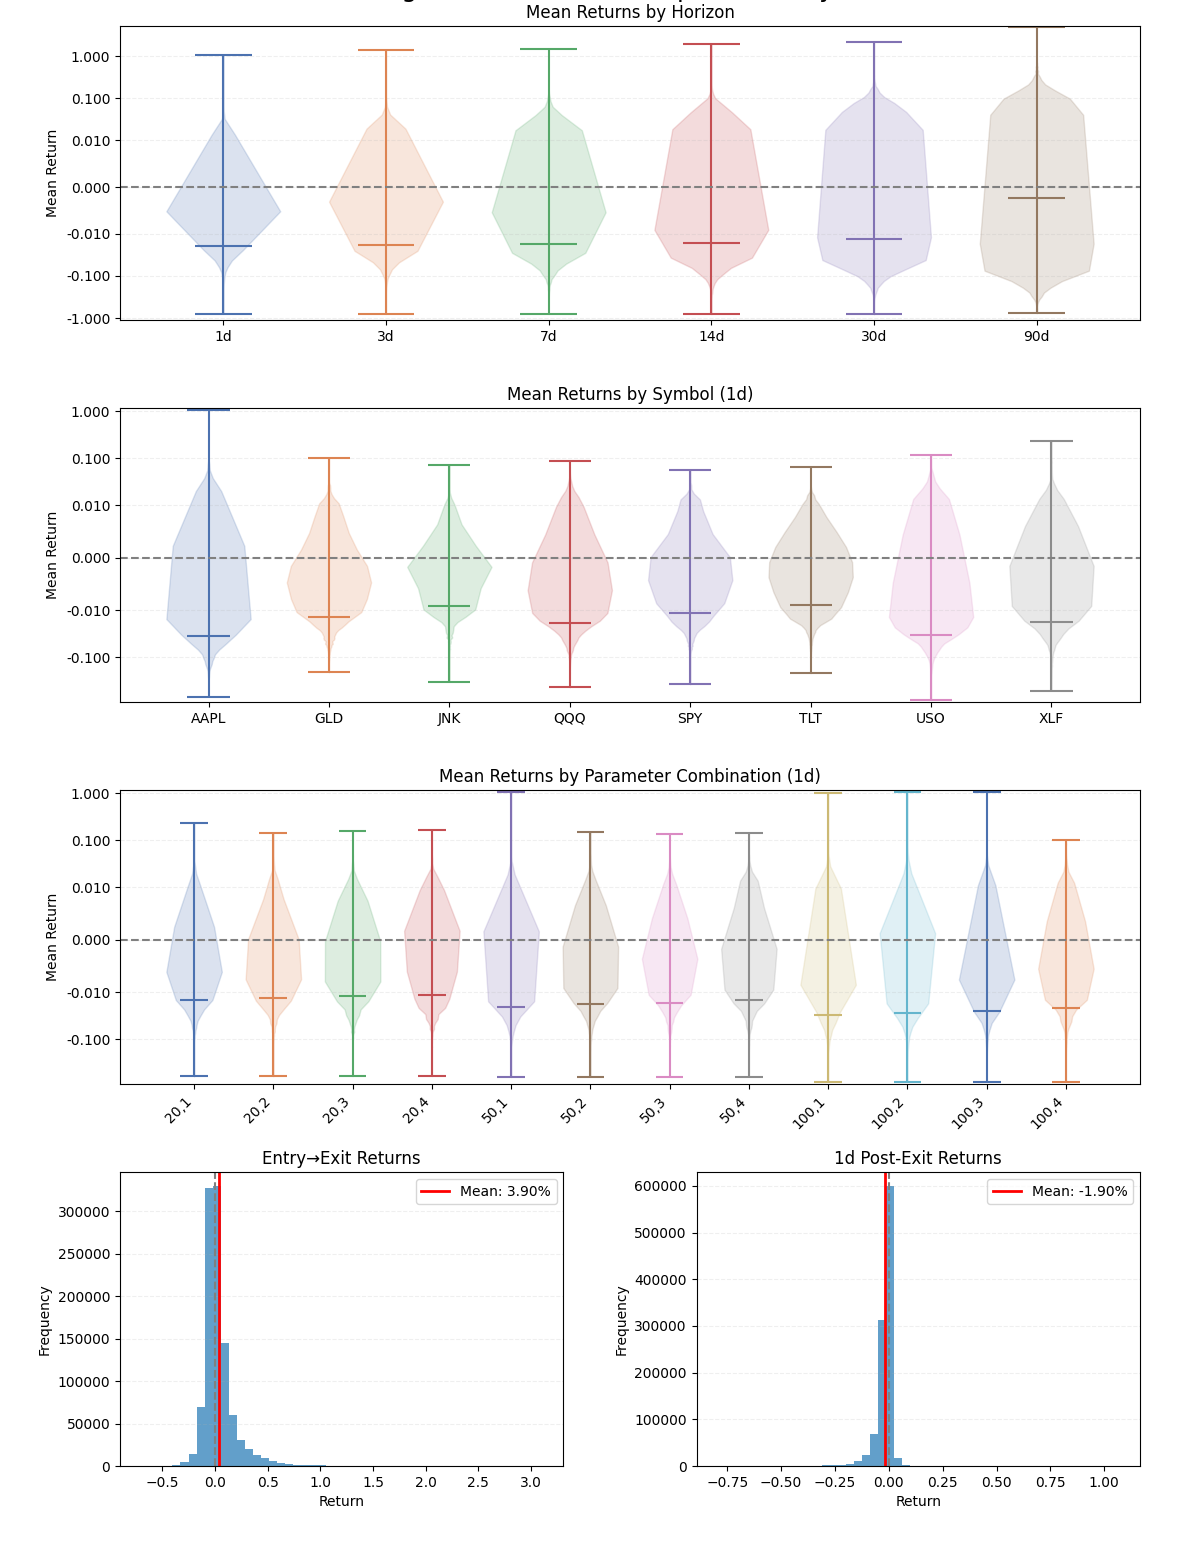
#7: 528 basis points upside gained, 97 basis points downside avoided
#8: 390 basis points upside gained, 190 basis points downside avoided
#9: 402 basis points upside gained, 185 basis points downside avoided

#10: 334 basis points upside gained, 223 basis points downside avoided


Applying These To Your Trading
And now, with 10 new completely unique classes of stop losses that deviate from the usual trailing, ATR, and Parabolic SAR (and perform way better than all of them too!), you can go and apply them to your systems today.
Why let your good trades suffer from using poor and outdated systems? Use something new, modern, and most importantly, better.
You can get the code for all of these systems in the private Google Drive for paid subscribers now:
Not yet a paid subscriber? Become one now and support my work!
Not only do you gain access to this code, but all of previous and future works as well. Your support helps me keep doing what I do best!

Finally, this project dumped out about 11GB of files. All of it is available to my Founding Members. Paid members of course get the 10 systems outlined in this post in complete Python code. But for those specialists that want to dig even deeper into what I did, the raw code, image, and data dump is available to those in the Founder Member subscription.
I want to thank all of my subscribers, paid or free, for supporting me and my work. I never thought I would be able to write about what I love most and gain such a great following.
If you have any ideas you want to see me touch on, join the chat and start a thread! I’ll respond to everyone personally.

Thanks again everyone, and happy researching!
I started a comment to point out that keltner channel stops are the same as ATR stops.
But I did some digging first and realized / remembered that Keltner bands are based on an n*ATR distance away from the EMA, and not based on a distance away from price. It’s not the same, and it’s reasonable that Keltner stops would outperform ATR stops.
Time to rethink my appreciation for Keltner channels.
Thanks for sharing.
So what does that pic of a nude woman have to do with stop losses? Who you spend your money on? Join the club.