


69% CAGR from 20 Stocks, 1 Trade a Month and How You Can Too
Using a state-of-the-art, yet intuitive and simple system to outperform the market.

In 2018, researchers Stěpán Balcar and Martin Pilát from Charles University in the Czech Republic published a revolutionary paper that combined the concepts of ensemble systems, evolutionary algorithms, and competition to create a highly adaptive trading system that claimed to greatly outperform the market.

Now, you would assume that such a sophisticated algorithm would require a large universe of stocks and careful, and often, rebalancing.
However, their system was able to achieve 71% annual returns since 2012 on only 20 stocks and rebalancing only once a month.
So how did they do it?
Well, although sophisticated, the system is highly effective. It uses a concept called Heterogeneous Islands to independently optimize 7 algorithms and have those compete at each rebalancing time (1 month).

Each island has its own optimizer and the islands do not communicate with each other. At each rebalancing phase, the algorithm sees which islands did the best, and gives the top more resources to then explore more between rebalance times.
Think of it as an immigration problem- islands that have more opportunity attract more workers, and thus can explore more potential solutions.
Want to Jump to the Strategy Code and Skip the “Blah Blah Blah”?
There are 7 islands that are used in the paper: Random Search, Hill Climb, Tabu Search, Simulated Annealing, Evolutionary Algorithm, Differential Evolution, Brute Force.
Each of these metaheuristics have their own situations where they work best, but that is often changing and dynamic based on the problem and the state of the system they are optimizing. And thus, this island system does a very good at managing resources between each system.
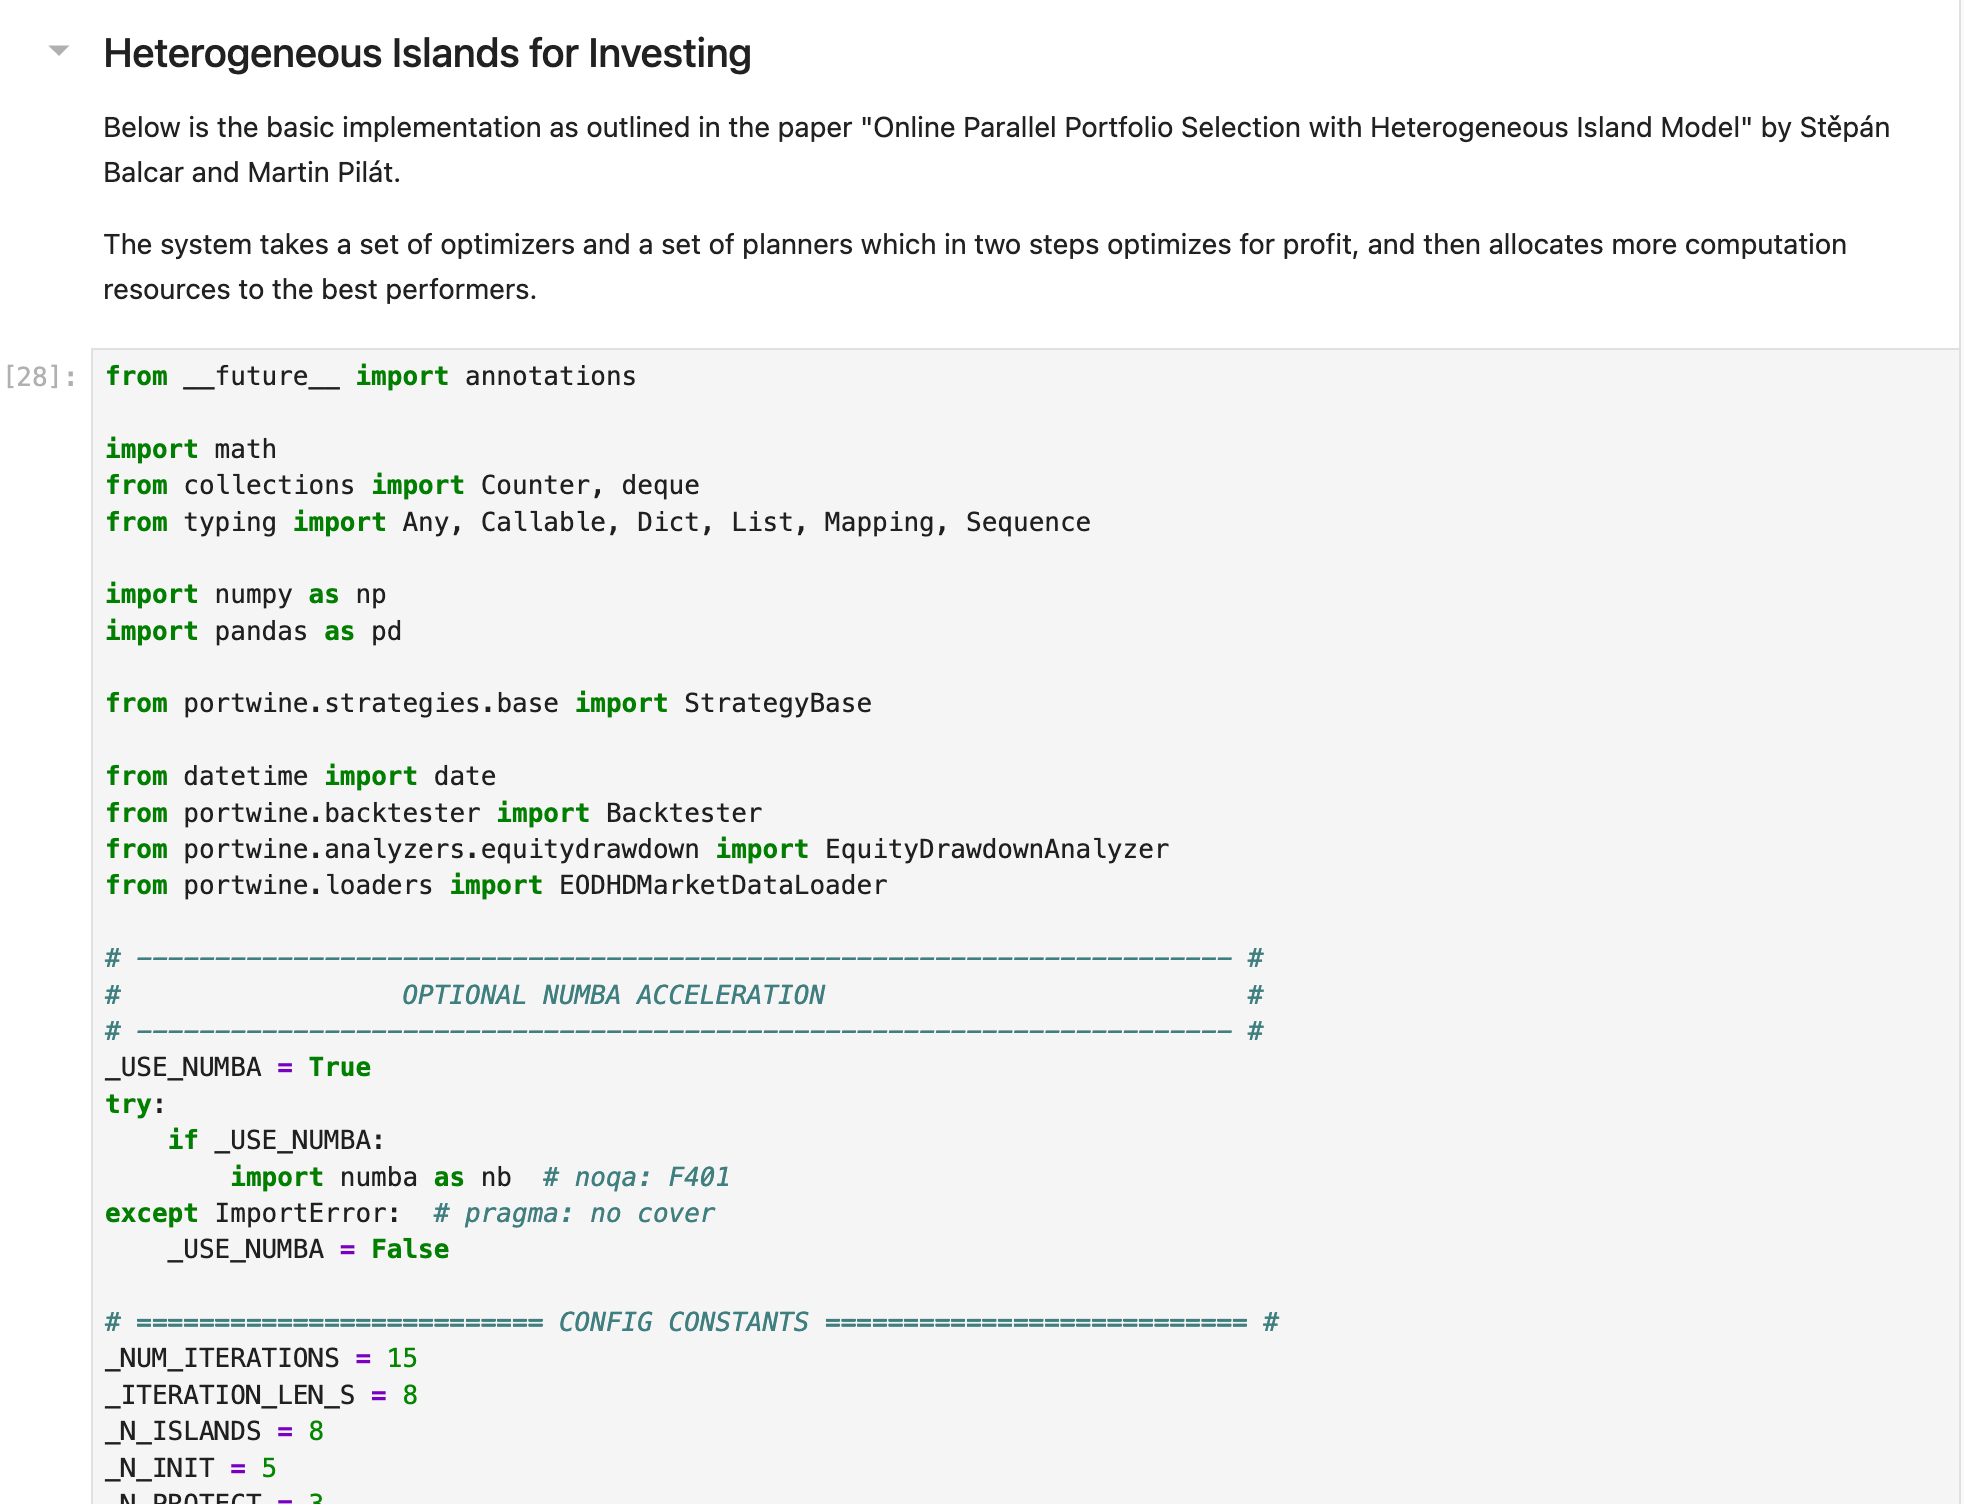
And so, I implemented the system in Python, using my portwine backtesting program (check it out here). Because the system is very computationally intensive, I used Numba to speed everything up.
A 20 stock basket made up of: AAPL, MSFT, AMZN, GOOGL, META, NVDA, TSLA, JPM, V, UNH, HD, PG, KO, MA, LLY, XOM, CVX, MRK, PEP, & WMT took about 2 minutes on an Apple M2 Max Macbook Pro with 12 cores.
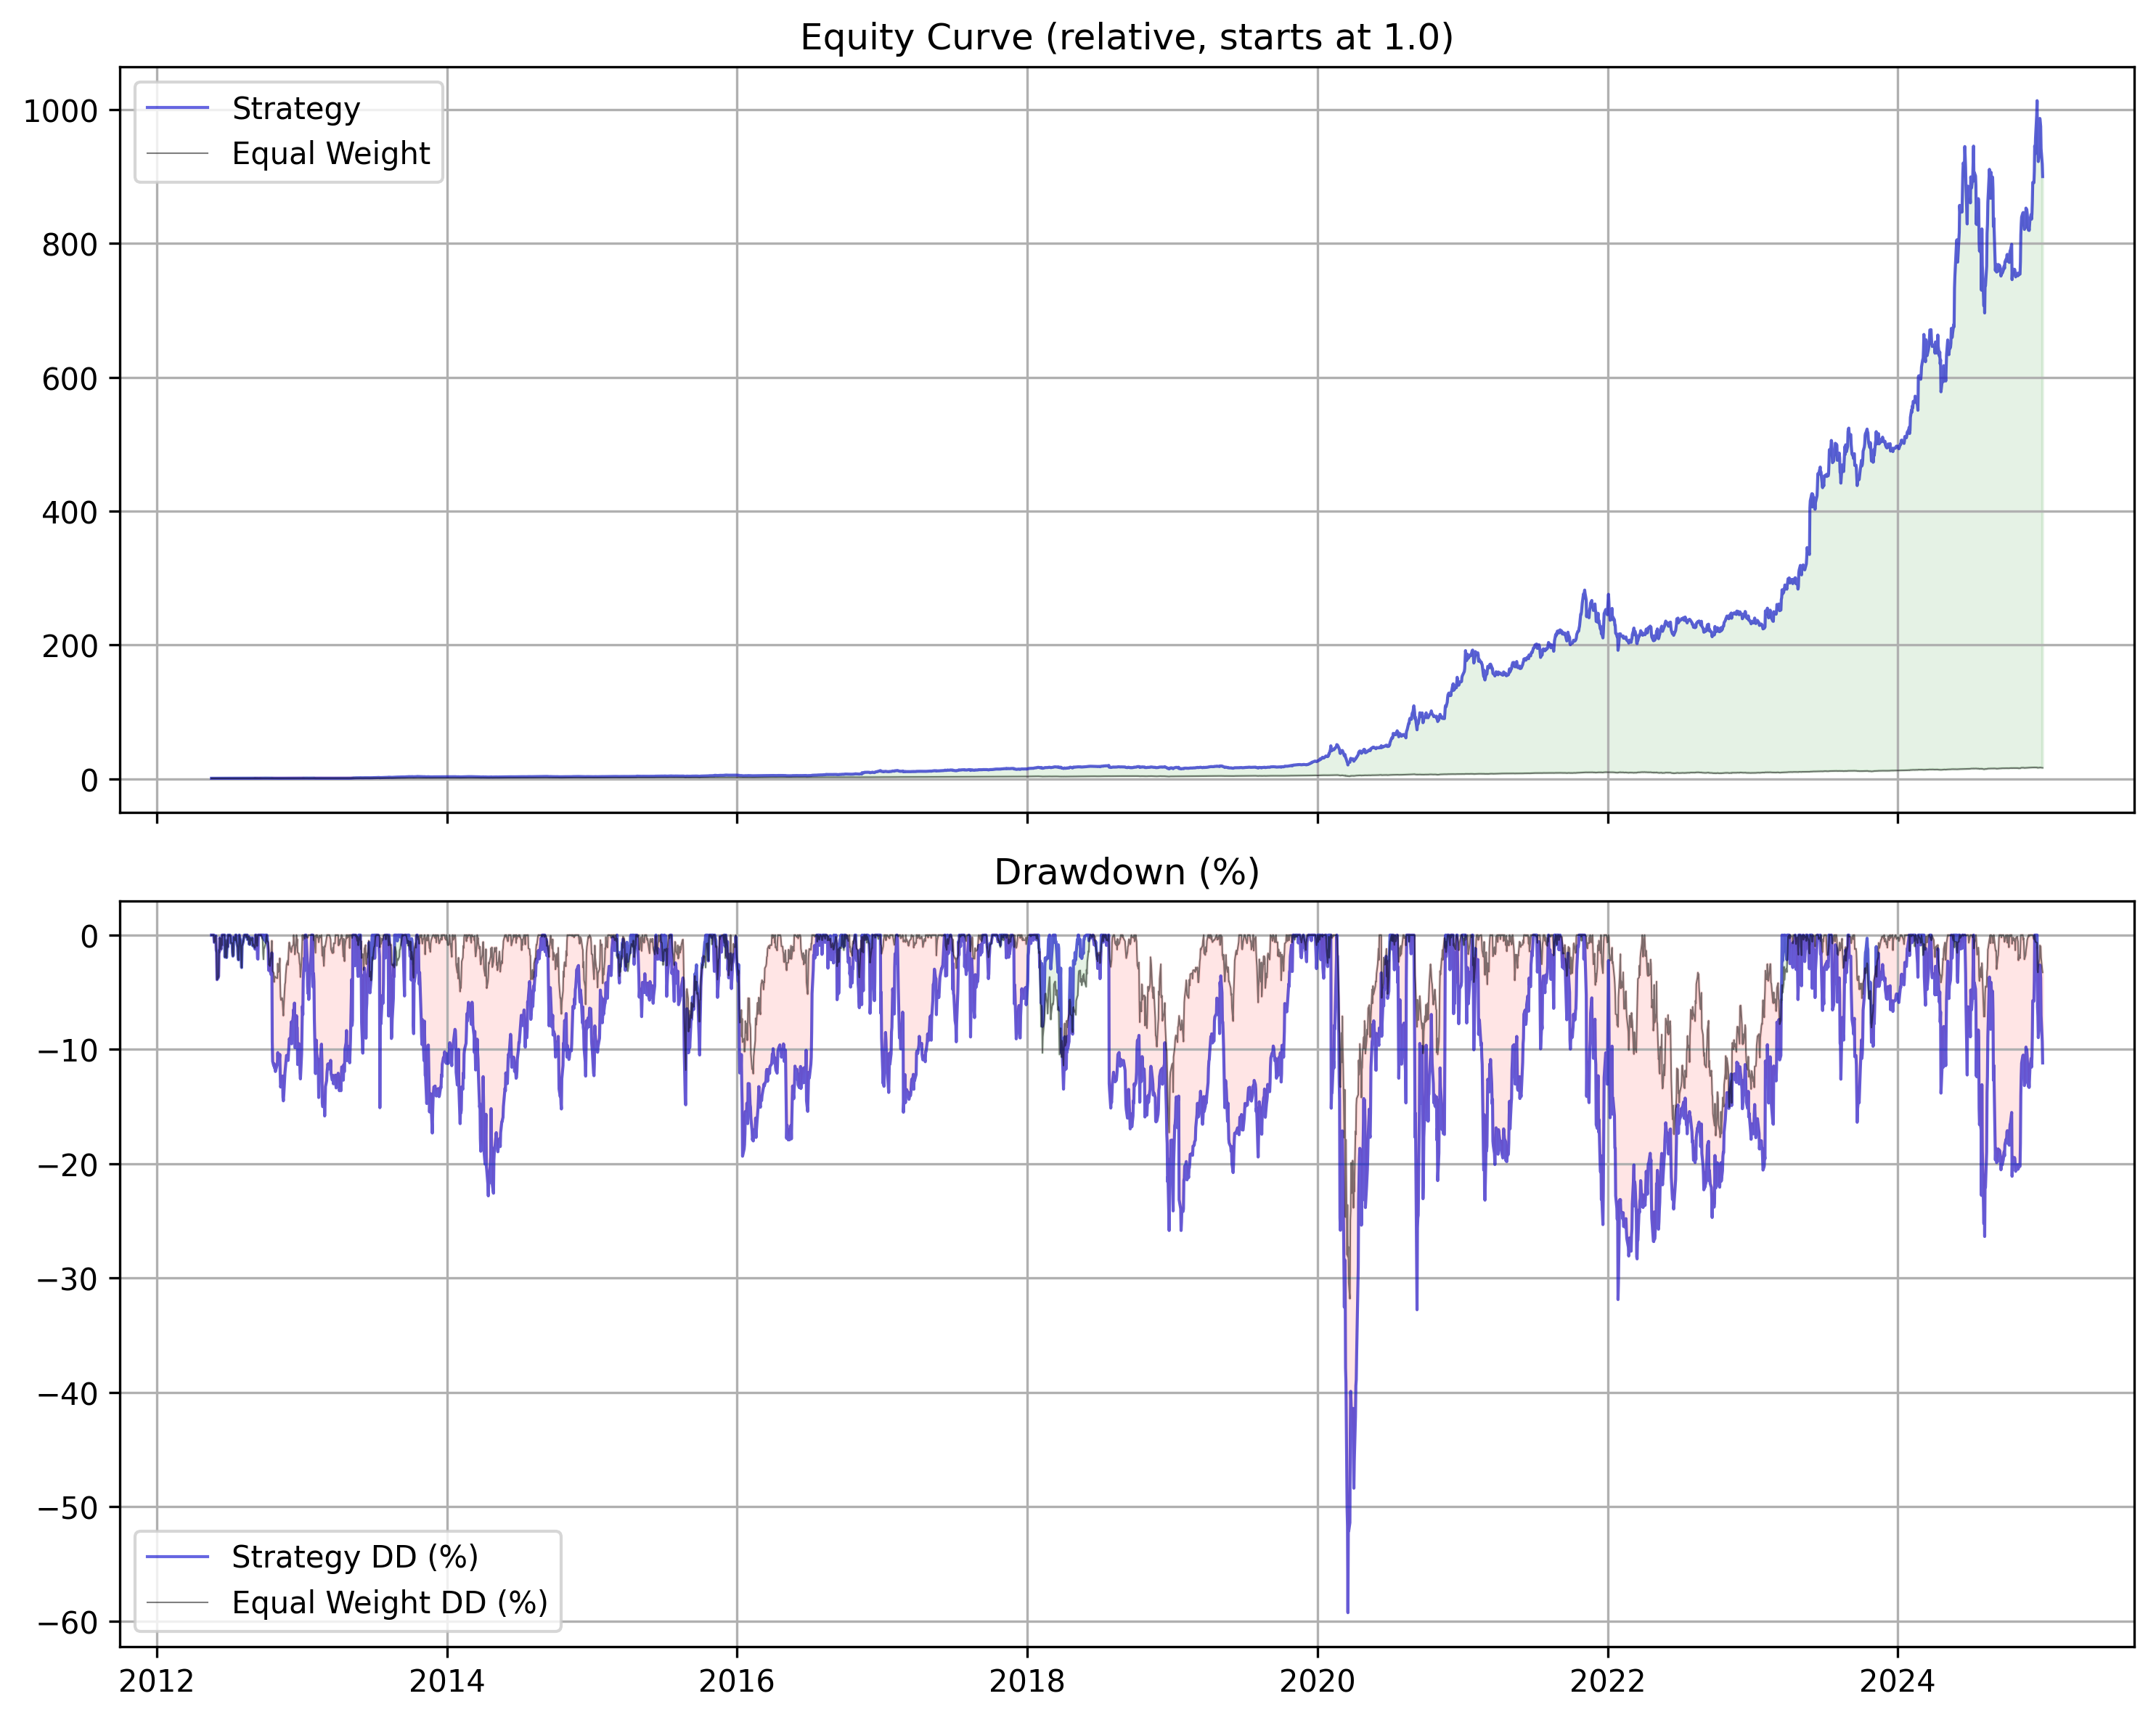
The Equity Curve and Drawdown (good)
=== Strategy Summary ===
TotalReturn: 89882.96%
CAGR: 71.58%
AnnualVol: 40.55%
Sharpe: 1.77
MaxDrawdown: -59.27%

=== Benchmark Summary ===
TotalReturn: 1565.84%
CAGR: 25.01%
AnnualVol: 17.15%
Sharpe: 1.46
MaxDrawdown: -31.81%

=== Strategy vs. Benchmark (Percentage Difference) ===
TotalReturn: 5640.25%
CAGR: 186.16%
AnnualVol: 136.51%
Sharpe: 21.00%
MaxDrawdown: -86.34%
The system smashes the performance of an equal weighted strategy, which tells us that it is not just the fact that these are blue chips that make them good.
The drawdown is about twice the benchmark, but returns more than double the CAGR, and so it’s better on a risk basis.
The Edge Decay (none)
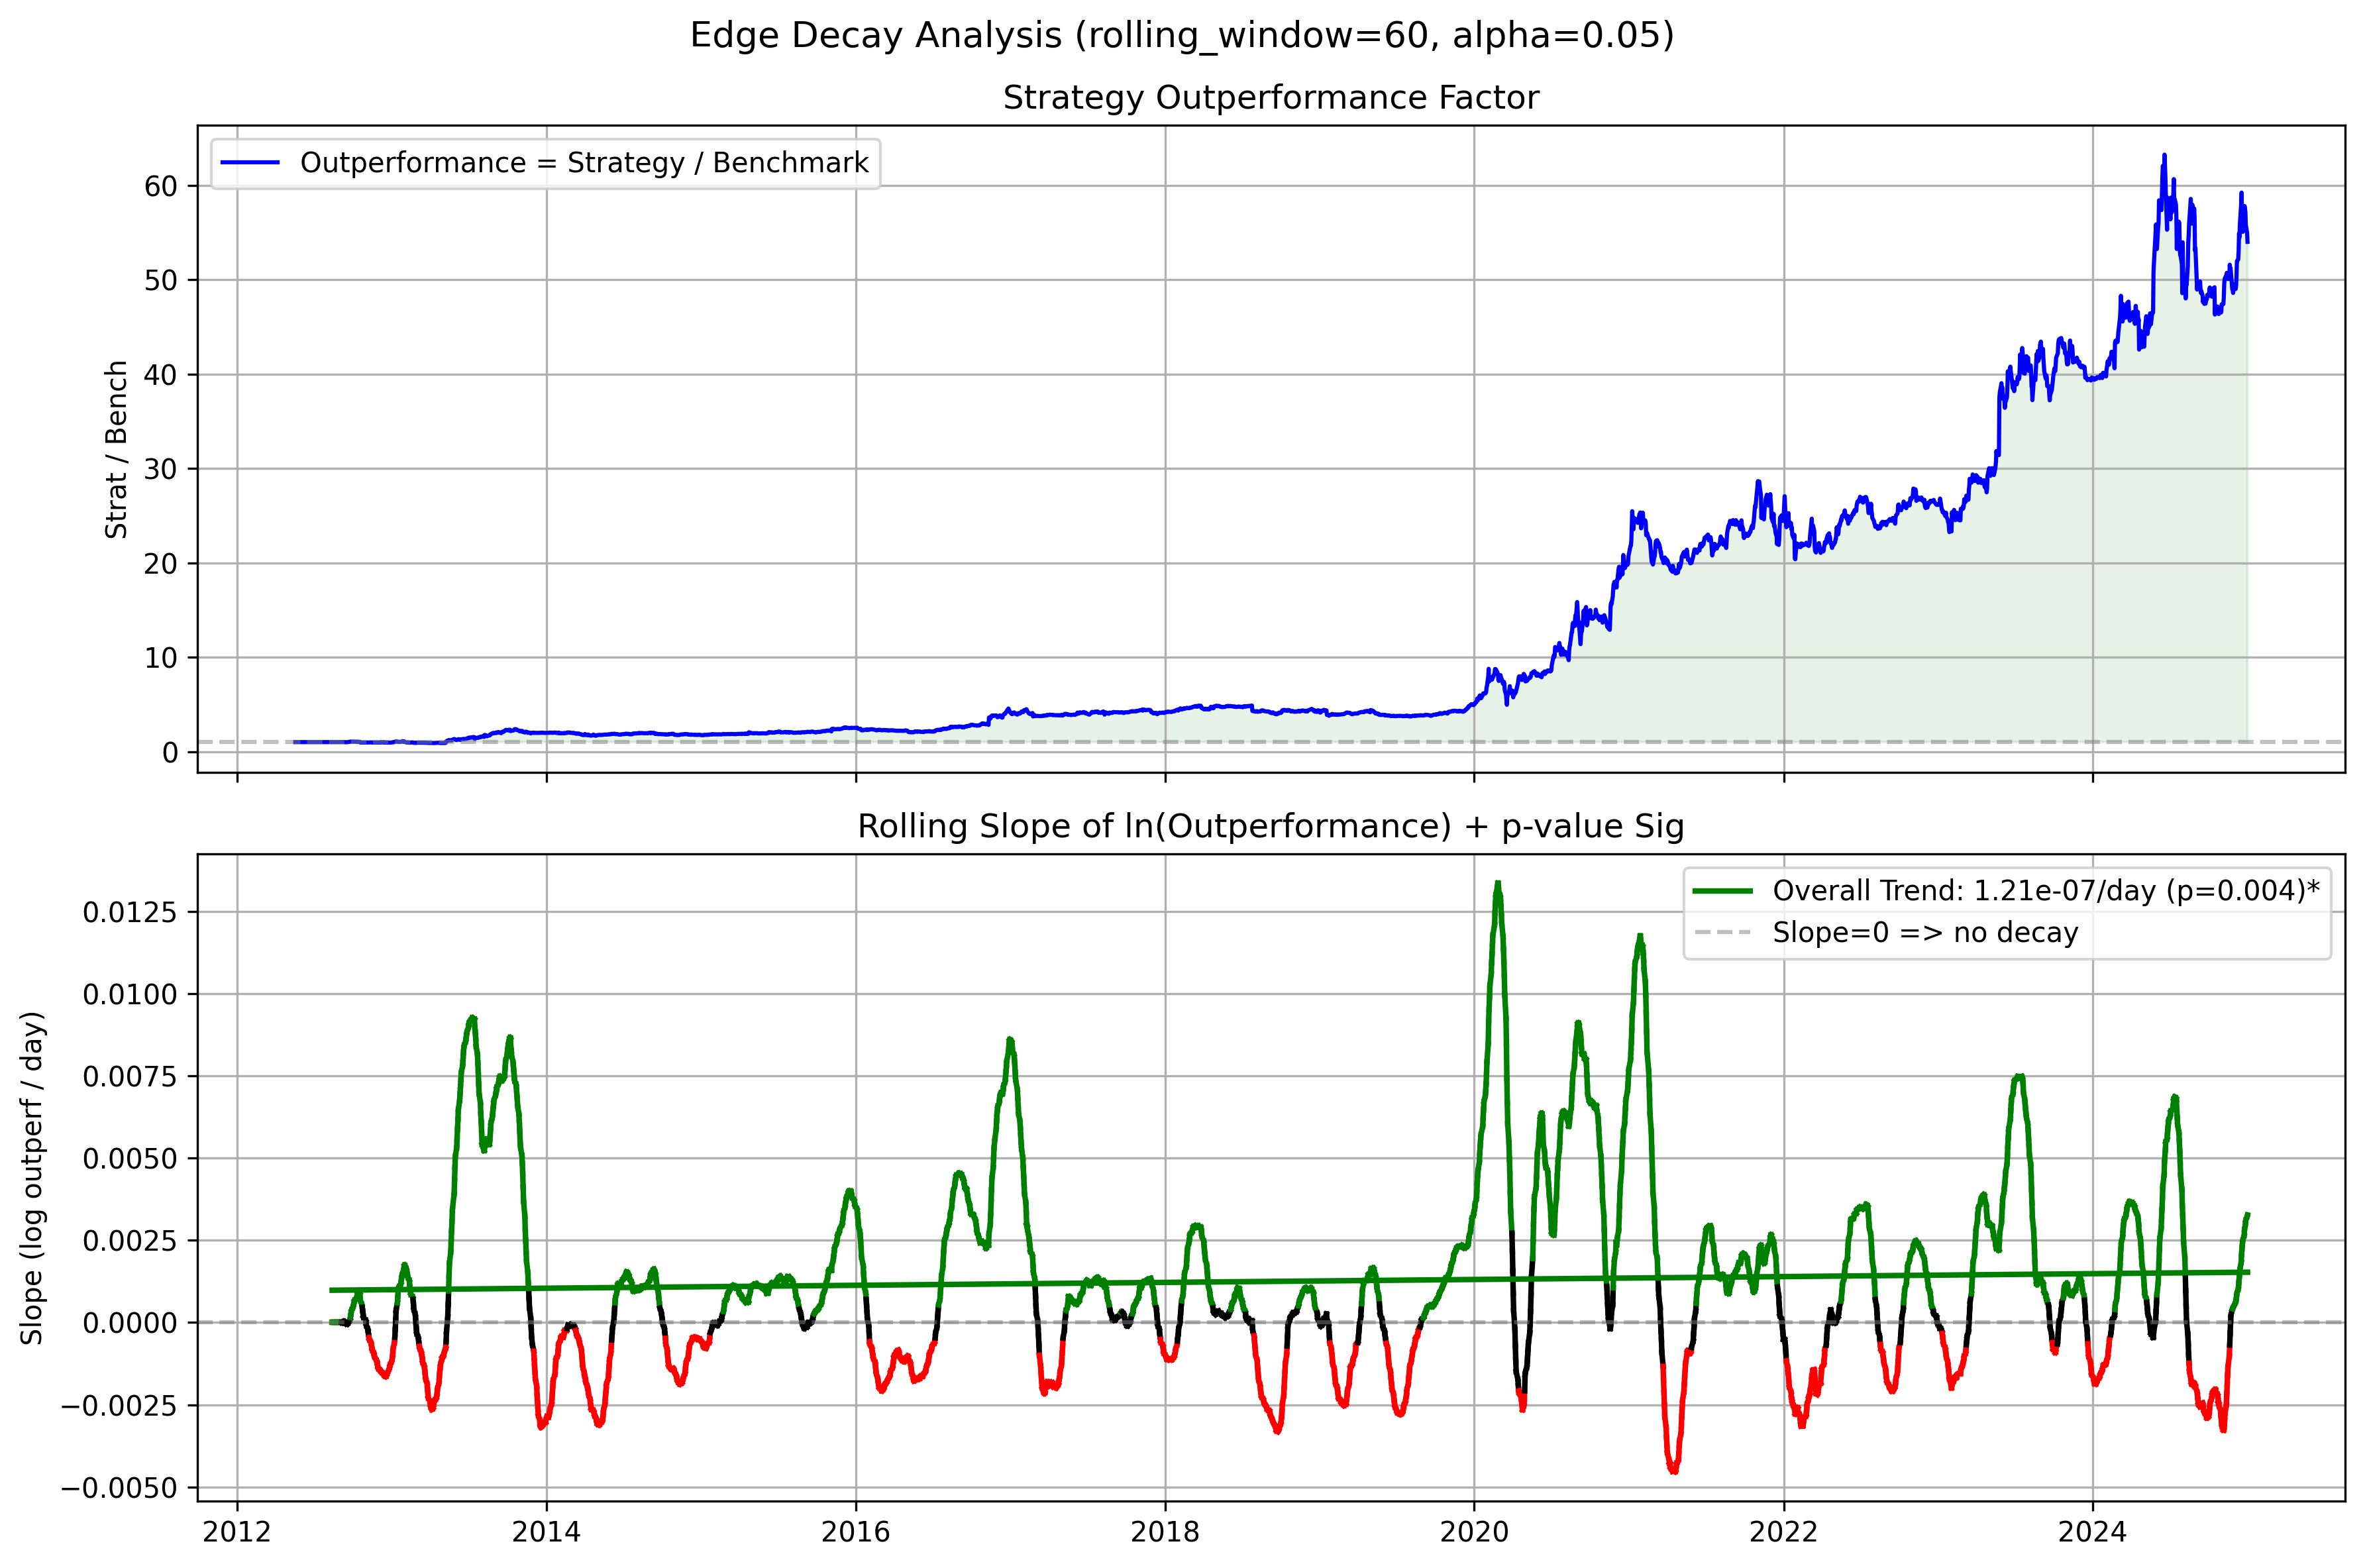
There is no edge decay. In fact, the edge is marginally improving over time, albeit at a snails pace. This tells us that this strategy is not using factors of yesterday’s market and can be used today to make investment decisions (at your own discretion).
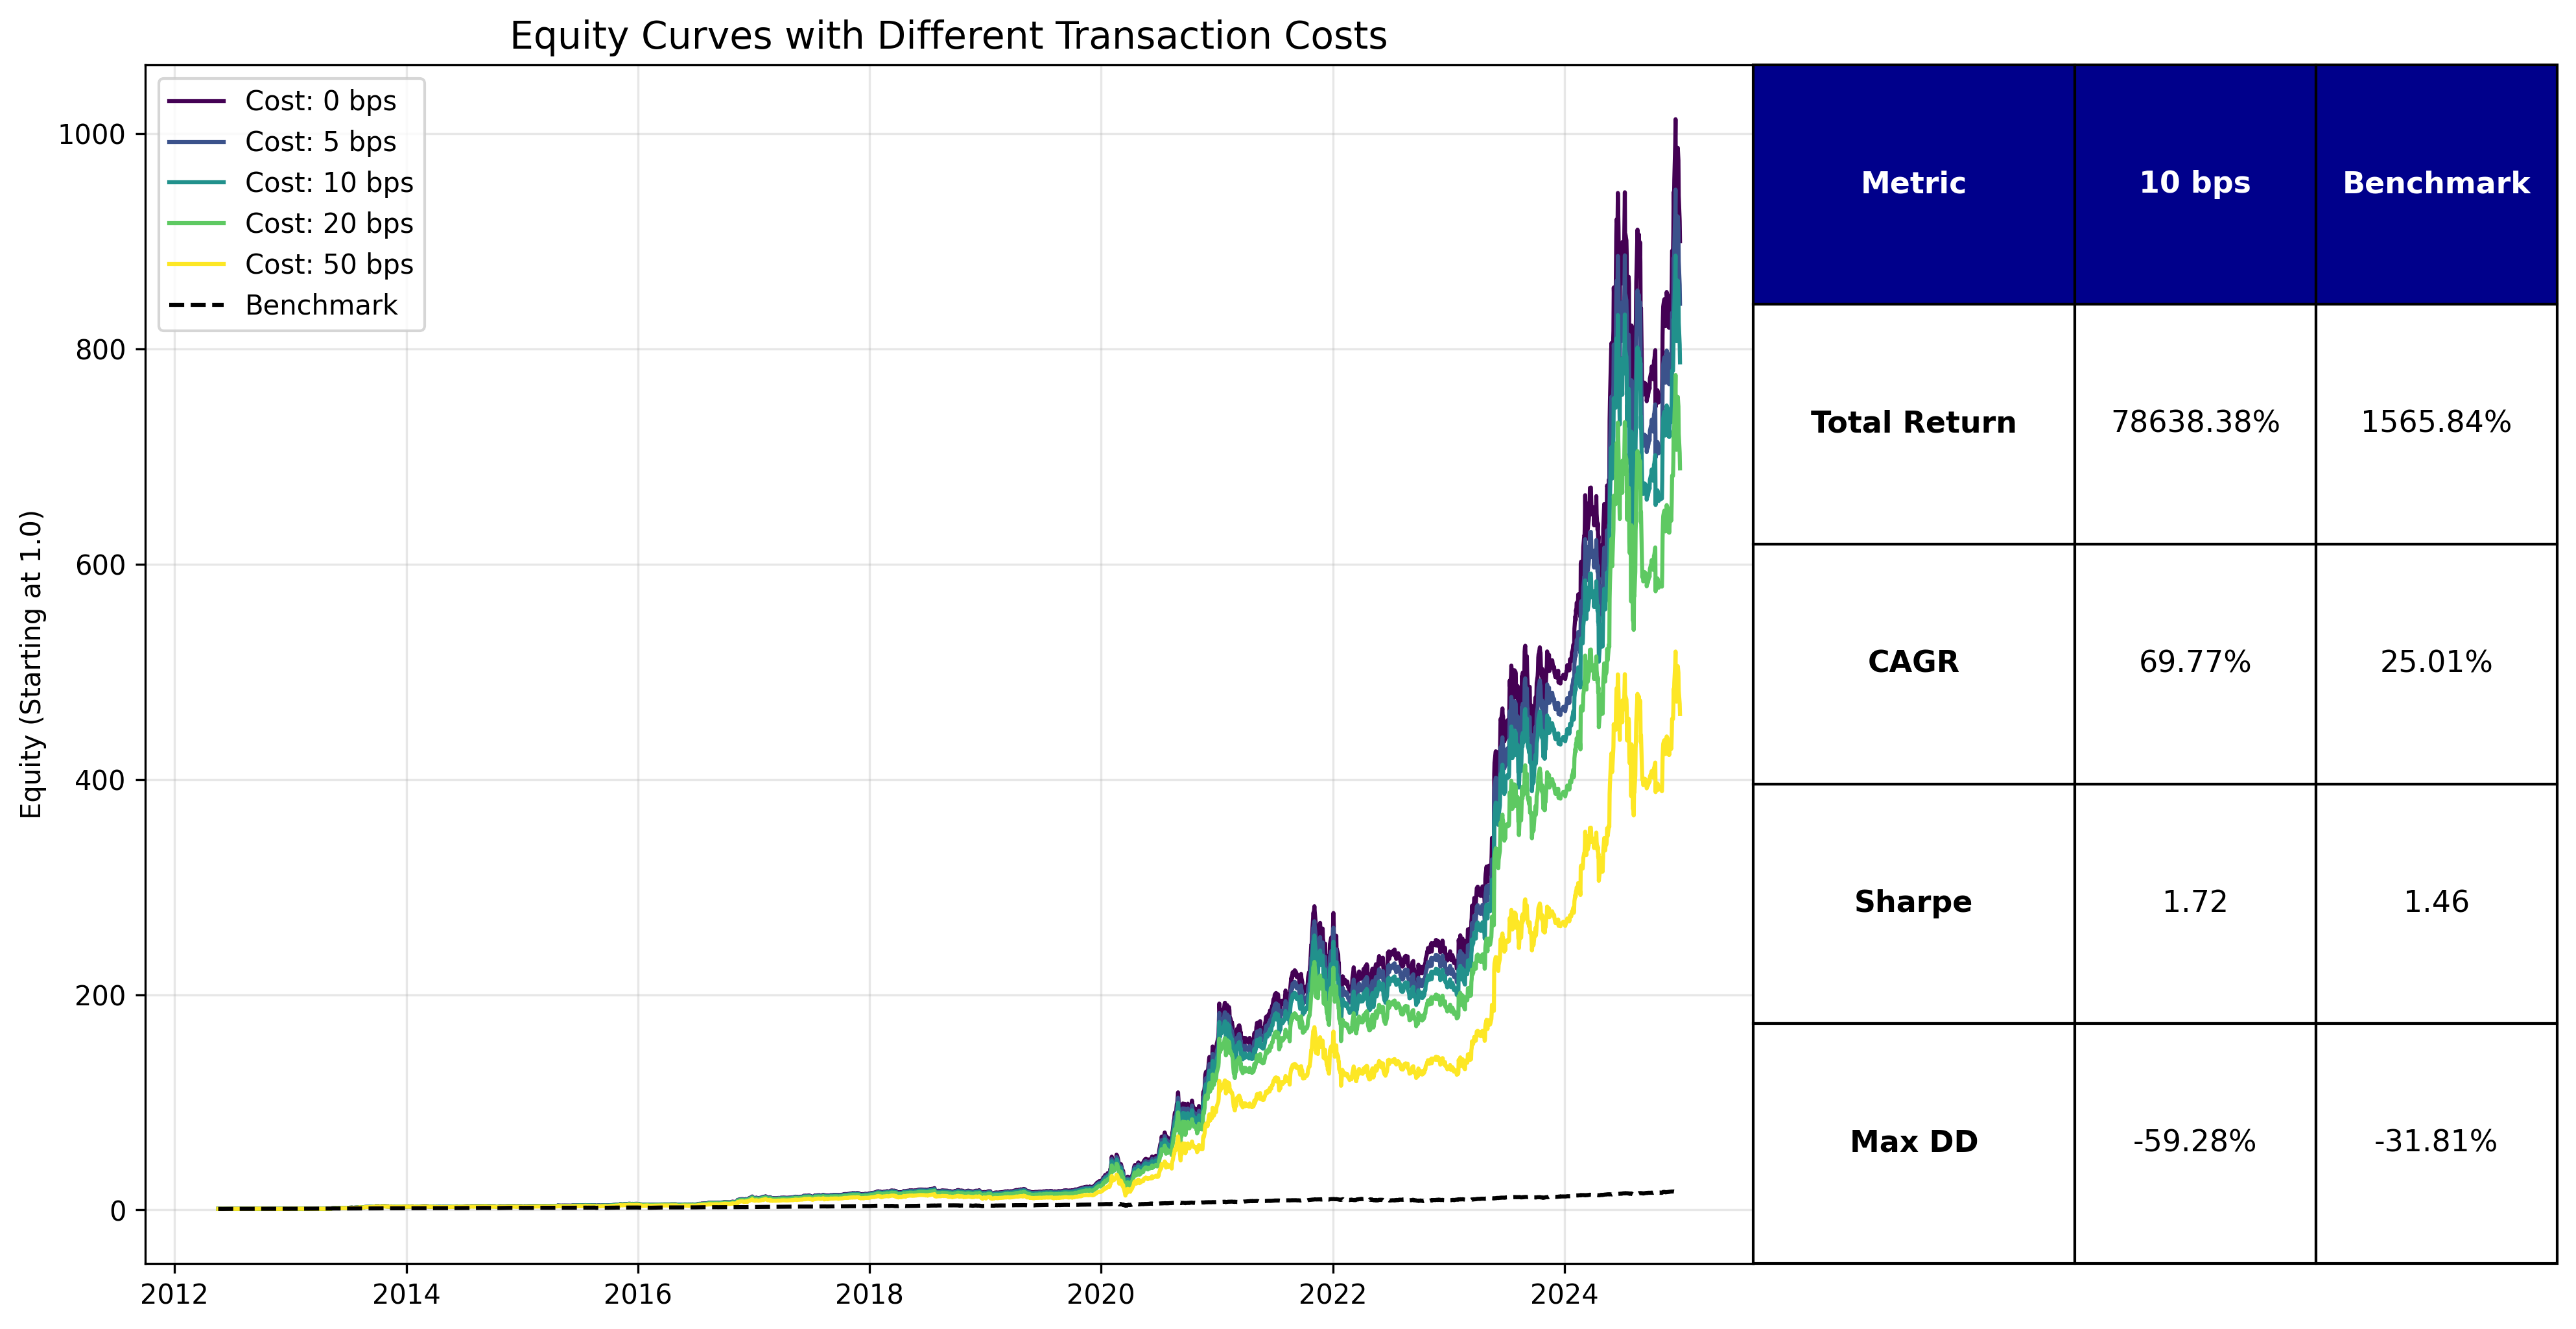
The Transaction Fees (few)
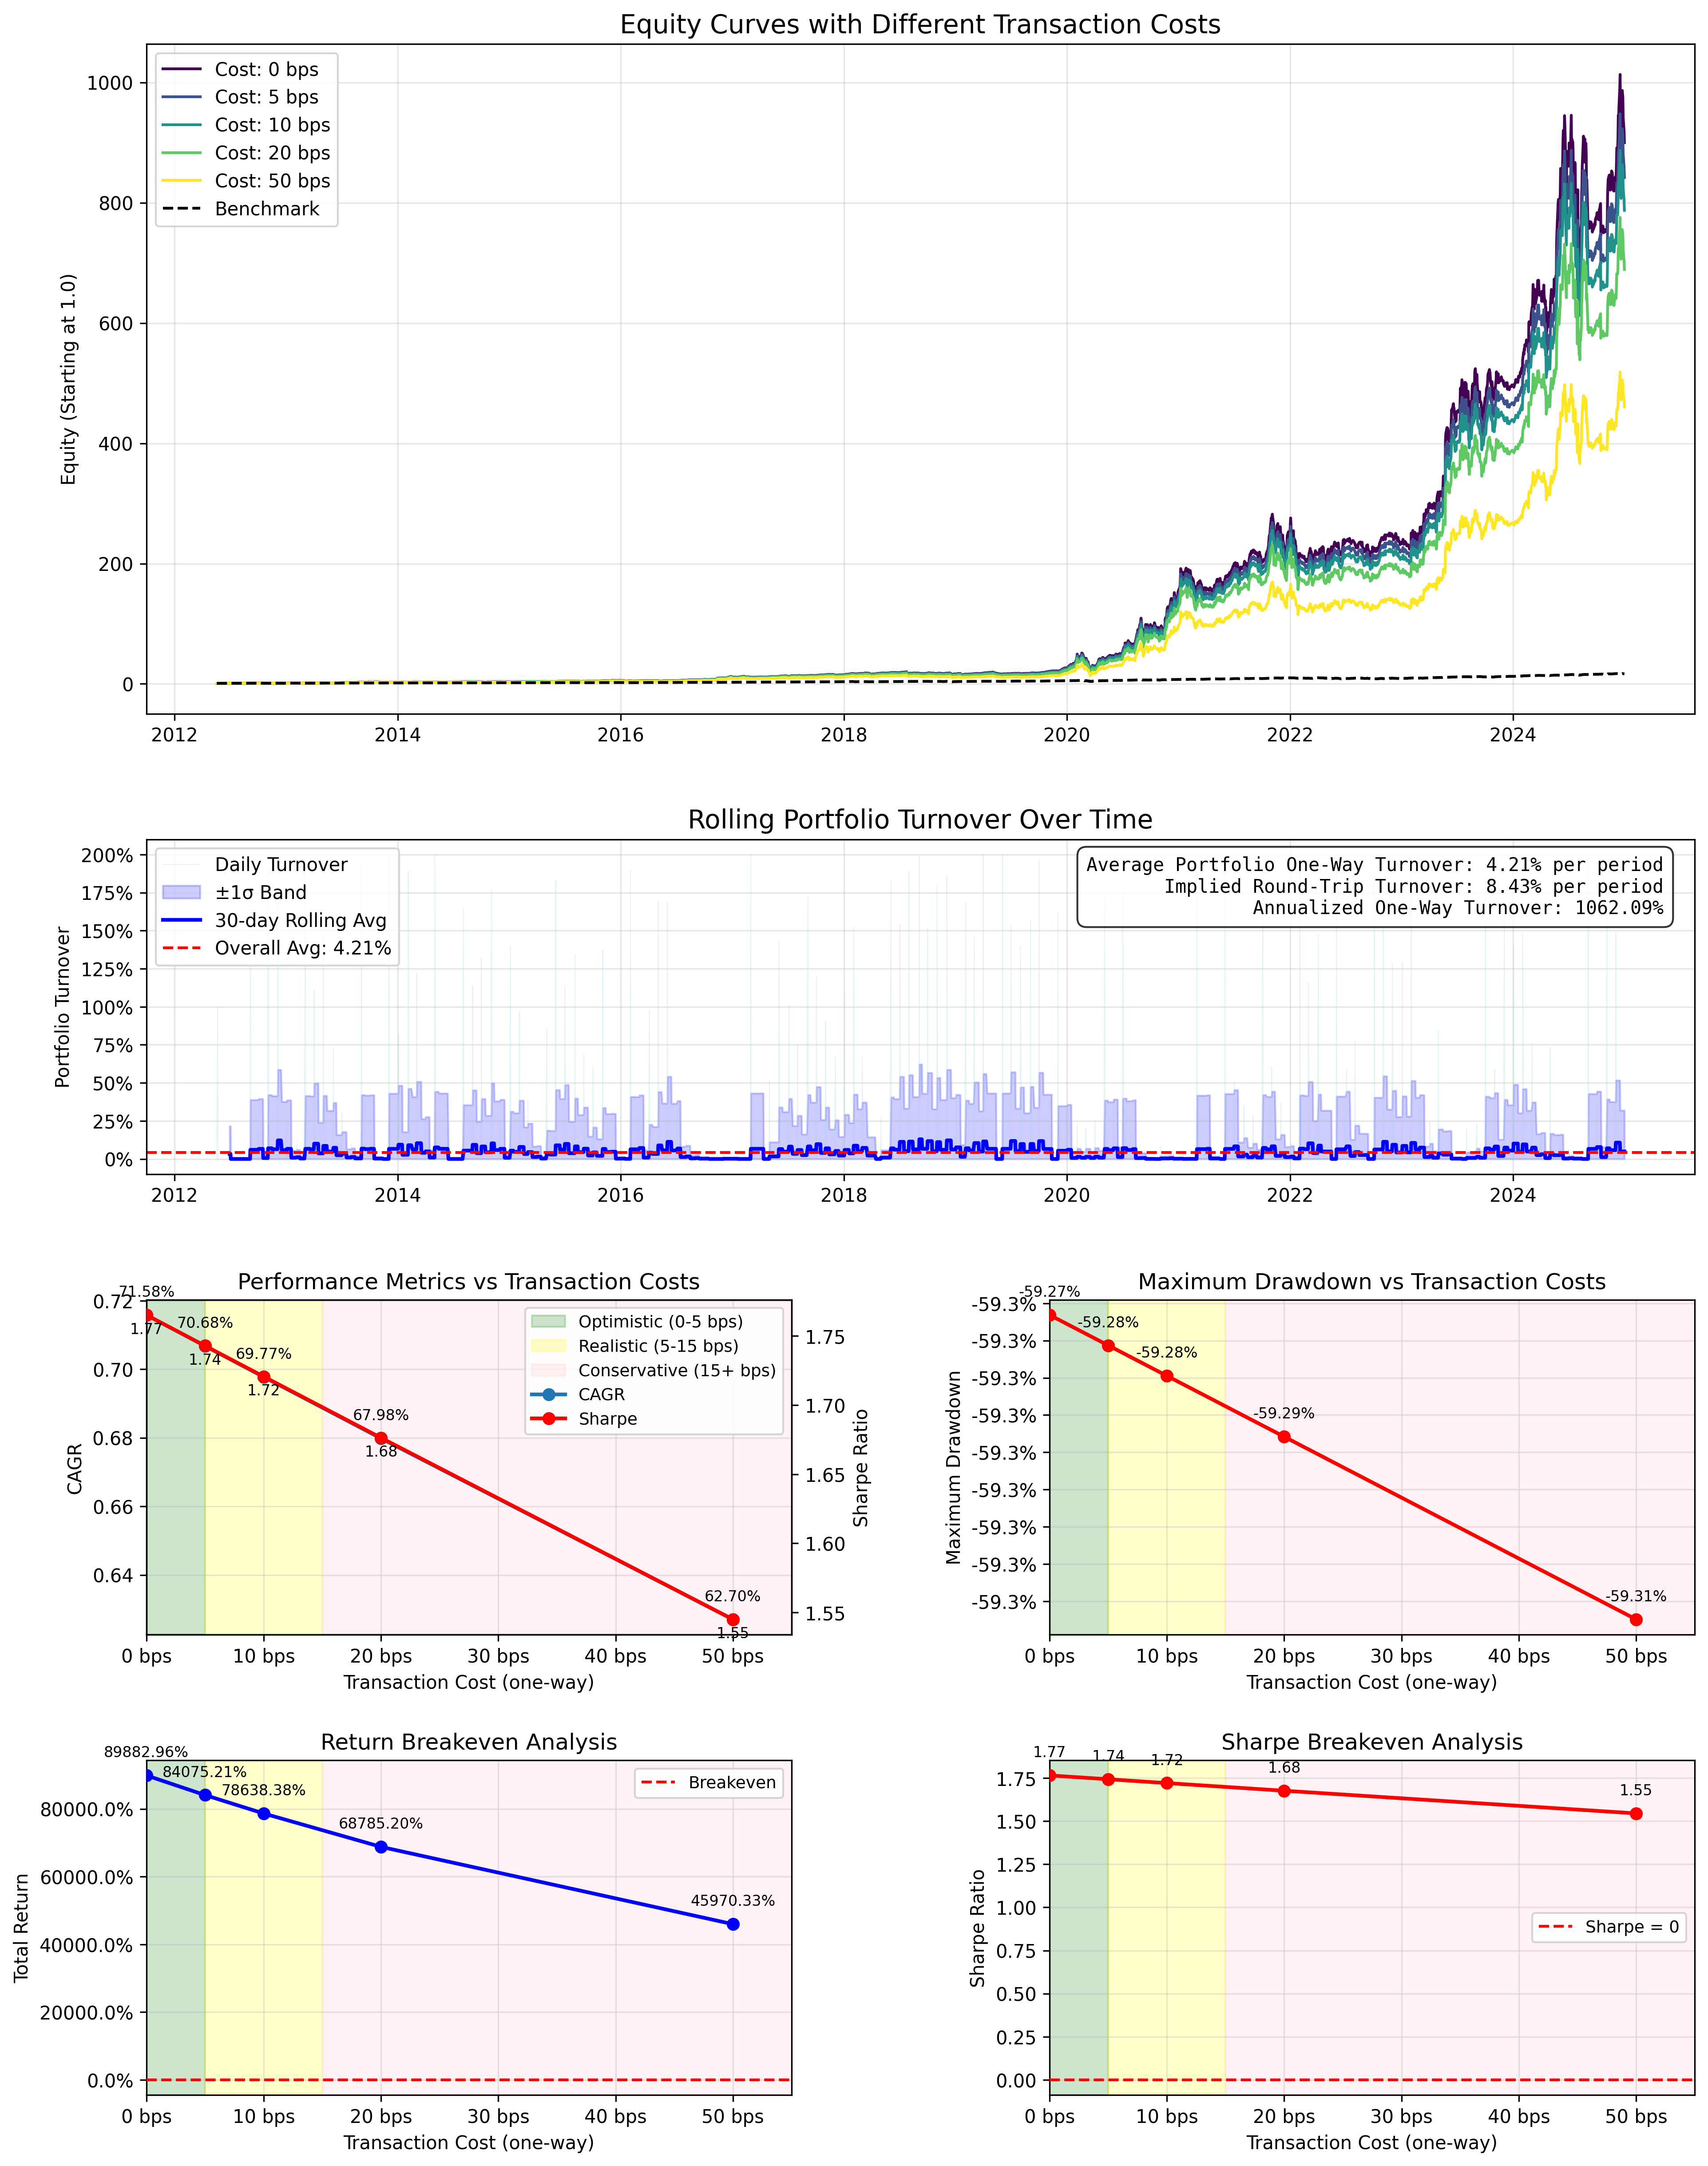
Also, because we only rebalance once a month, the performance you are seeing is accurate. Even at 50 basis points, we still get 62% CAGR and a sharpe that is better than buy and hold.
Next Steps
Ready to play with the code and test out your own configurations or even deploy it live? Go ahead and click on the button below to view the notebook:
Not a paid subscriber?
Become one now and gain access to this strategy and all other strategies that I’ve written about, and will in the future. Your support not only gives you access to this premium content, it supports my mission in providing you and the public with great, easy to access content on the world of quantitative analysis.
Your support is everything to me, paid or free. And so, thank you so much for being with me in my journey! Happy researching!
What were the criteria for selecting those 20 stocks? I believe this type of analysis may be subject to hindsight bias.
Can I propose the next test of long the 7 island weights, short equal weights please?
+46.5% per annum with killer Sharpe?